
Solarwinds Log and Network Performance Pack
Network performance and log monitoring in a single unified console
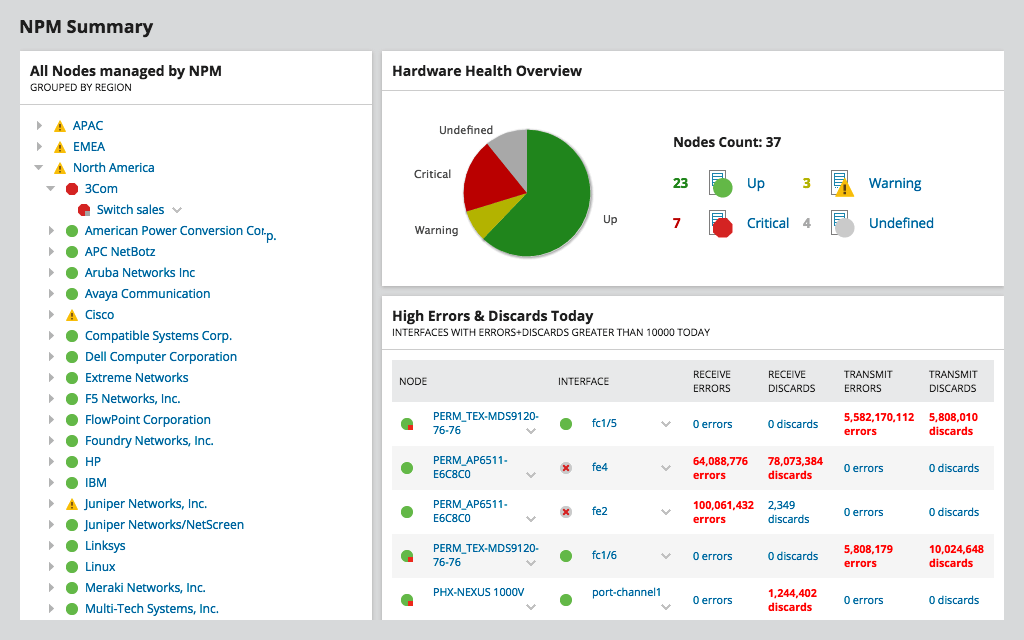
Network Performance Monitor
.png)
Log Analyzer
Overview:
Why Bundle?
- Reduce network outages
Quickly detect, diagnose, and resolve multi-vendor network fault, availability, and performance issues. - Aggregate, search, and chart log data
Collect, consolidate, and analyze thousands of syslog and traps to perform root cause analysis. - Accelerate time to resolution
View log data and network performance side-by-side with seamless Orion® Platform integration.
What Does The Log and Network Performance Pack Including?
Network Performance Monitor
Reduce network outages and improve performance with advanced network monitoring software
- Multi-vendor network monitoring
- Network Insights for deeper visibility
- Intelligent maps
- NetPath and PerfStack for easy troubleshooting
- Smarter scalability for large environments
- Advanced alerting
Log Analyzer
Easily investigate machine data to help identify the root cause of IT issues faster
- Log and event collection and analysis
- Powerful search and filter
- Real-time log stream
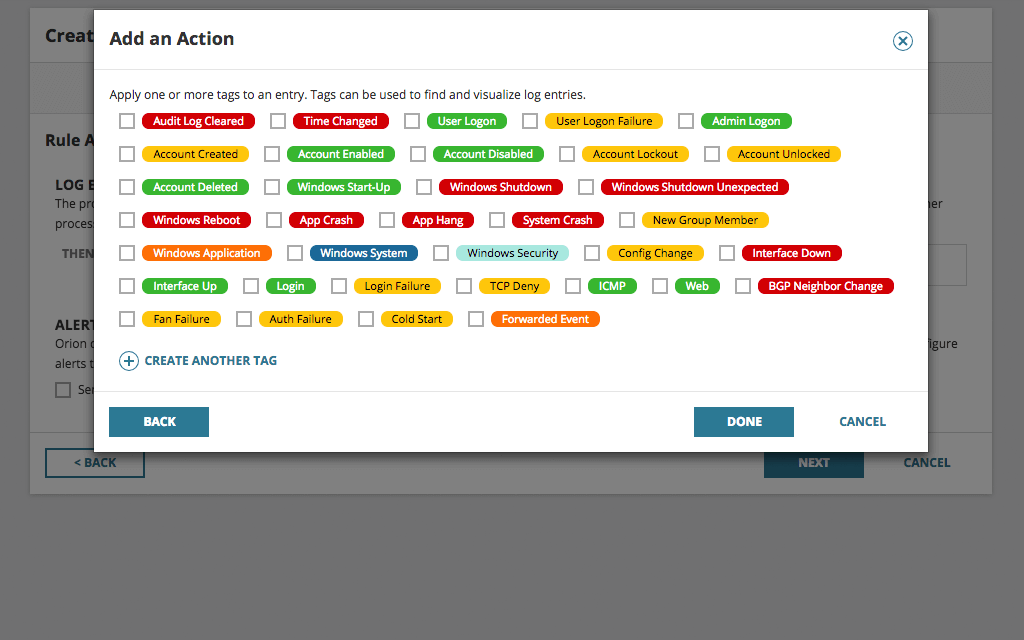
- Event log tagging
- Flat log file ingestion
- Orion Platform integration
What's Included:
| Network Performance Monitor | Log Analyzer | Log and Network Performance Pack | |
|---|---|---|---|
| Includes: NPM, Log Analyzer | |||
| Quickly detect, diagnose, and resolve multi-vendor network performance issues | |||
| View physical and logical device relationships with auto-updating maps | |||
| Critical path hop-by-hop analysis on-premises and in the cloud | |||
| Visually correlate network performance on a common timeline | |||
| See performance metrics for autonomous access points, wireless controllers, and clients | |||
| Reduce the flood of unnecessary alerts with intelligent, dependency, and topology-aware alerts | |||
| See log data in real-time with an interactive chart and graph | |||
| Collect, consolidate, and analyze thousands of syslog and traps to perform root cause analysis | |||
| Execute searches using multiple search criteria and apply filters to narrow results | |||
| Tag log data to aid with filtering, searching, and identifying performance issues |
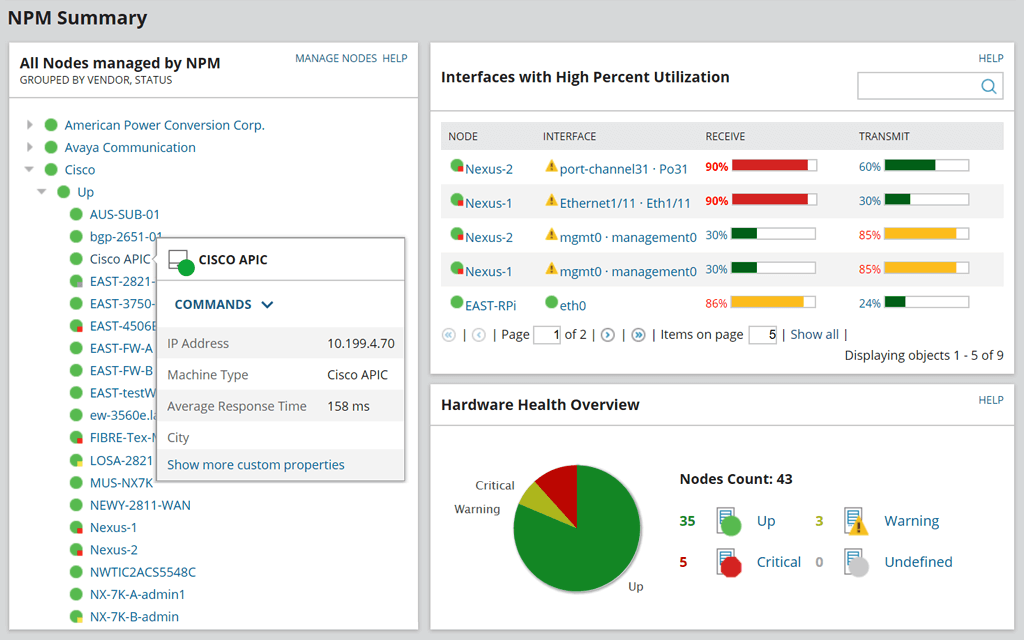
Network Performance Monitor:
Comprehensive fault monitoring and performance management for your network.
Reduce network outages and quickly detect, diagnose, and resolve multi-vendor network performance issues with affordable, easy-to-use network monitoring software.
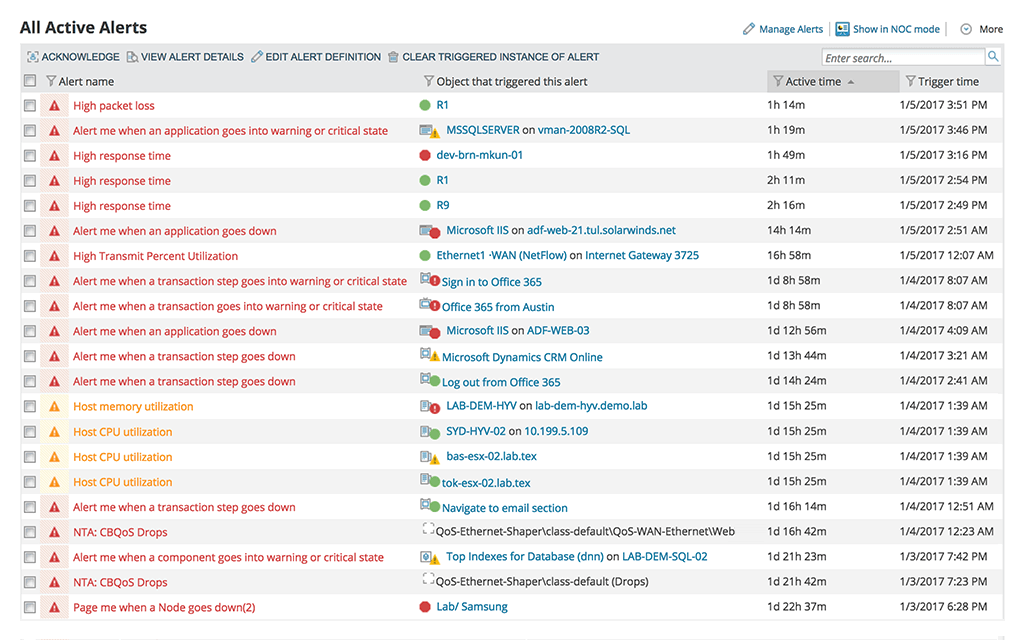
Get to the root cause quicker with intelligent, dependency and topology-aware network alerts.
Reduce the flood of unnecessary network alerts. Create alerts based on simple or complex nested trigger conditions, defined parent/child dependencies, and network topology.
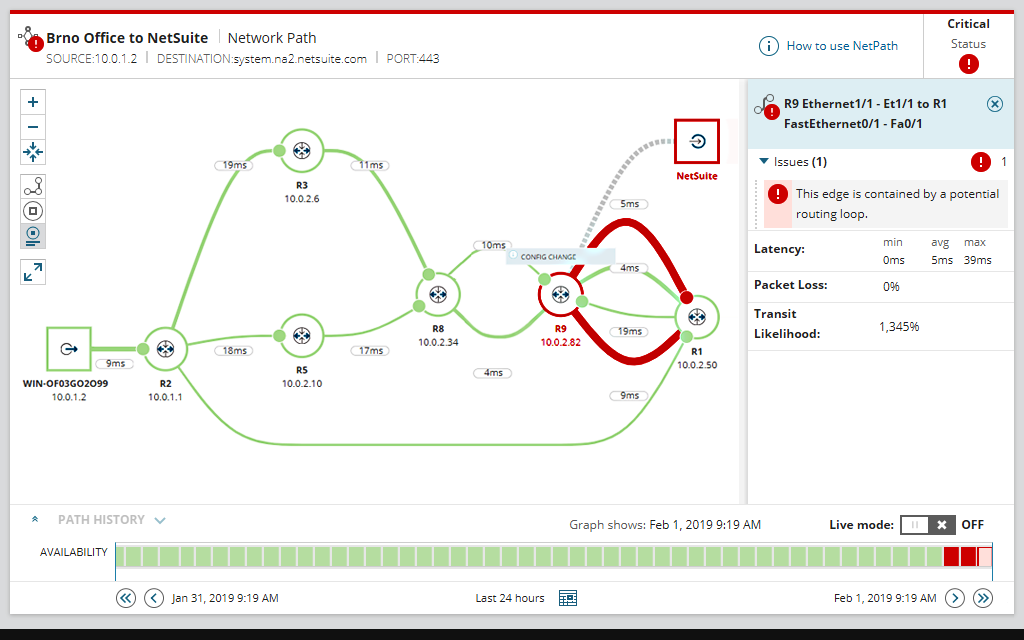
Hop-by-hop analysis of cloud or on-prem applications or services.
Monitor critical business services on-prem or in the cloud with NetPath network path analysis. You can see changes along the path, identify service provider issues, and use historical views to review the path before a problem occurs.
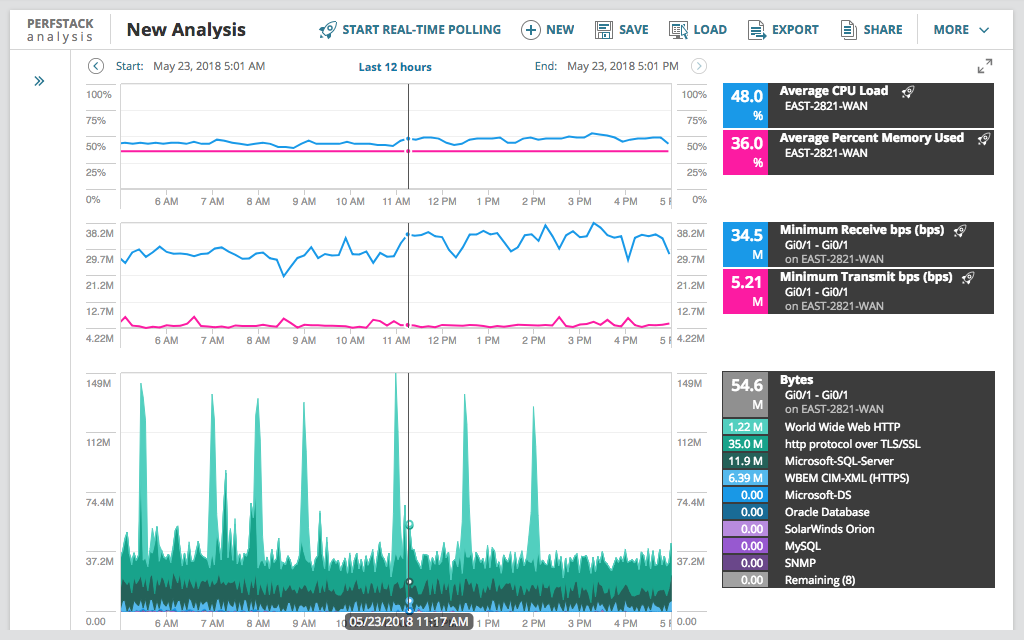
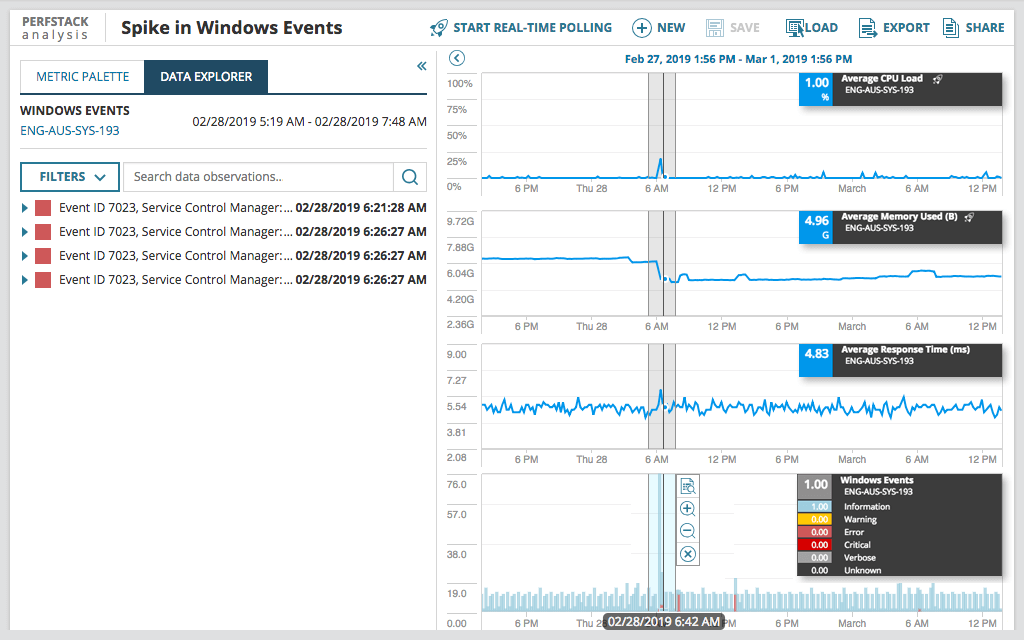
PerfStack™ cross-stack network data correlation.
Accelerate identification of root cause by dragging-and-dropping network performance metrics on a common timeline for immediate visual correlation across all your network data.
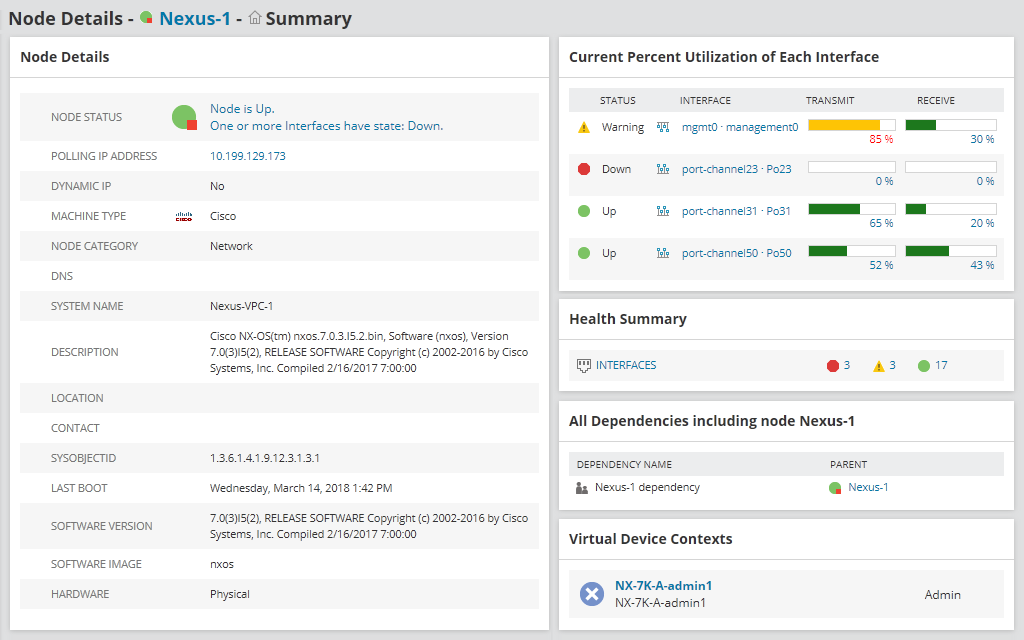
Contextual monitoring for advanced network devices.
Today’s networks are more complex, with more advanced hardware. Simply knowing if a device is up or down doesn’t tell you how your load balancer is managing application delivery or if your firewall is blocking the right traffic. Network Insight features for Cisco ASA, Cisco Nexus, F5 BIG-IP, and Palo Alto Networks help you troubleshoot your switches, firewalls, and load balancers like an expert.
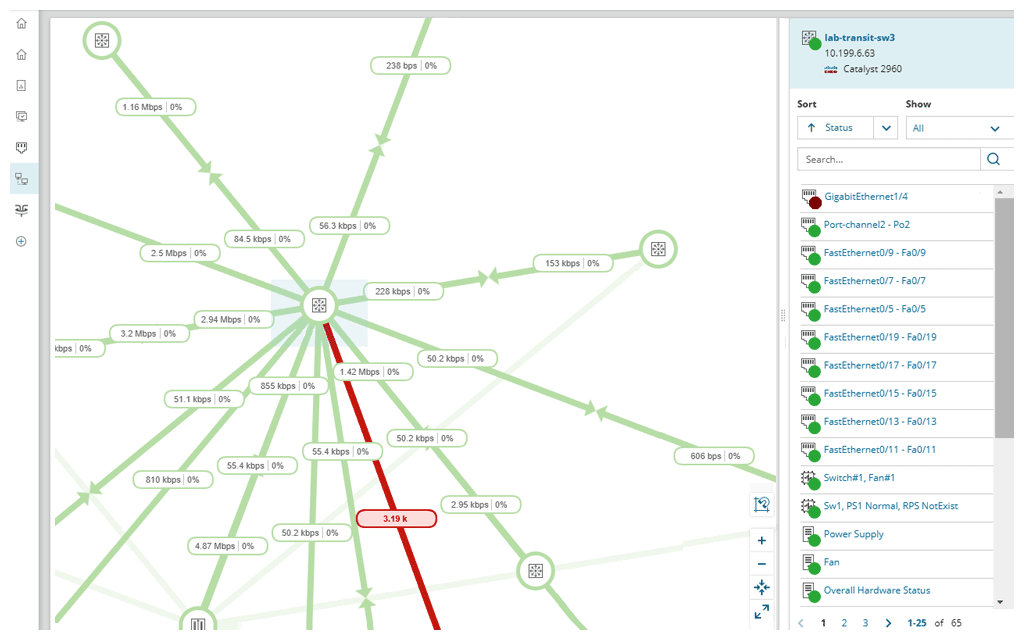
Automatically updated network maps.
See relationships for routers, switches, interfaces, volumes, and groups, updated automatically without user intervention.
Want more customization? Build network maps from scratch or import auto-generated maps, customize layouts, and add them to any view or dashboard using the new Orion® Maps widget. Spend time maintaining your network, not your network maps.
Measure the health of the logical network in addition to the physical network with Cisco ACI support.
Monitor logical components of the SDN environment, including APICs, tenants, application profiles, endpoint groups, and physical entities directly from your network monitoring tool.
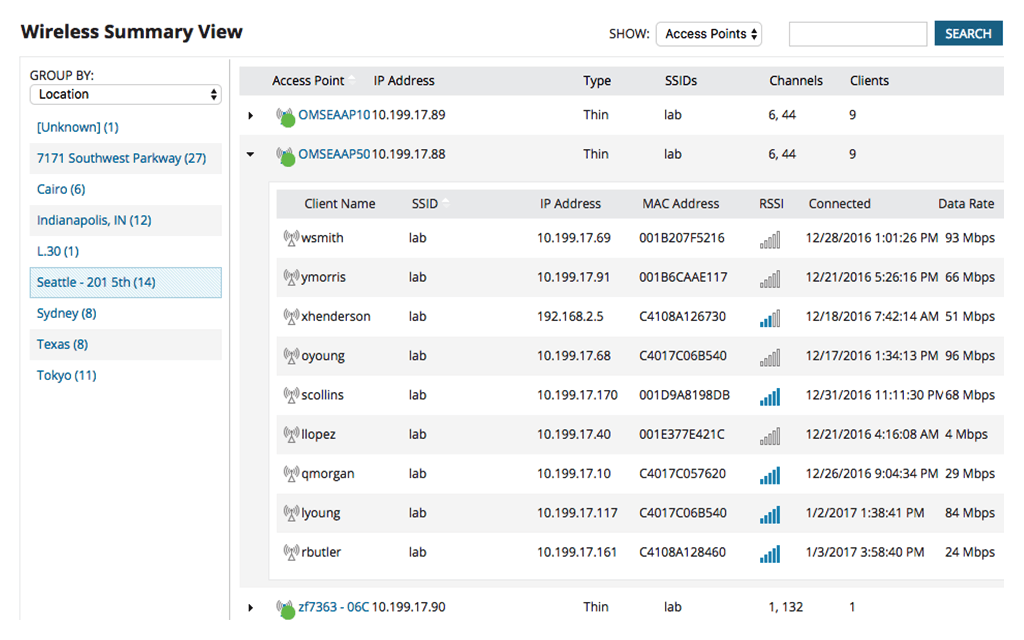
See performance metrics for autonomous access points, wireless controllers, and clients.
Easily identify dead zones and improve wireless coverage. With our network monitoring tool, you can access out-of-the-box wireless reports, including wireless availability and rogue access points.
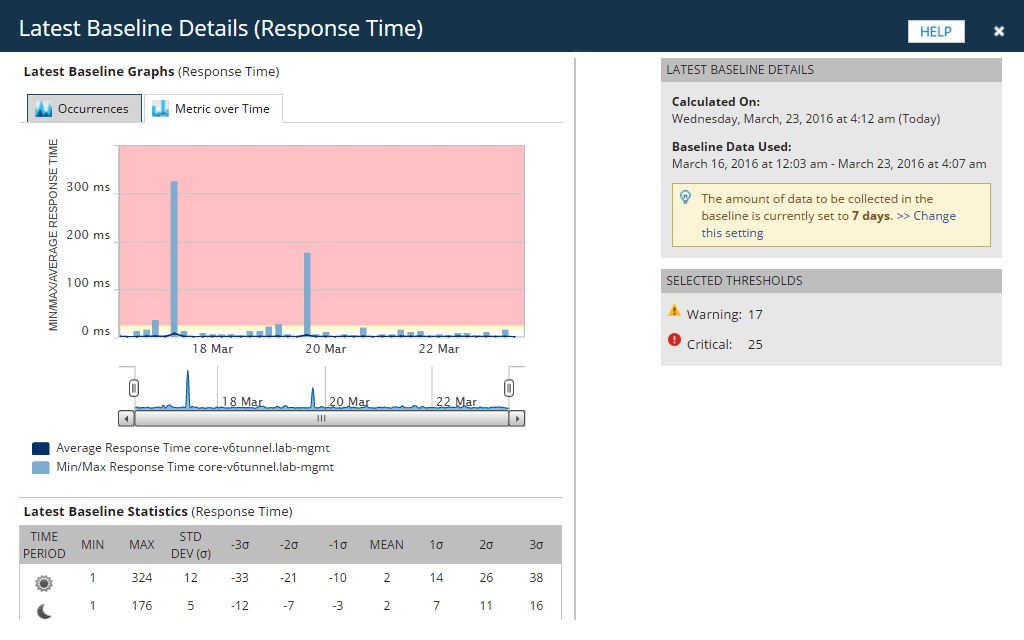
Dynamically calculate baseline thresholds from historical network performance data.
Configure alerts accurately by calculating dynamic baseline threshold data with our network performance monitoring software.
Scale up to monitor more elements or poll more frequently, or scale out to multiple locations.
Drop disparate network monitoring tools and get comprehensive data in an integrated platform for greater visibility into monitoring network performance, all with flexible deployment and a lower TCO.
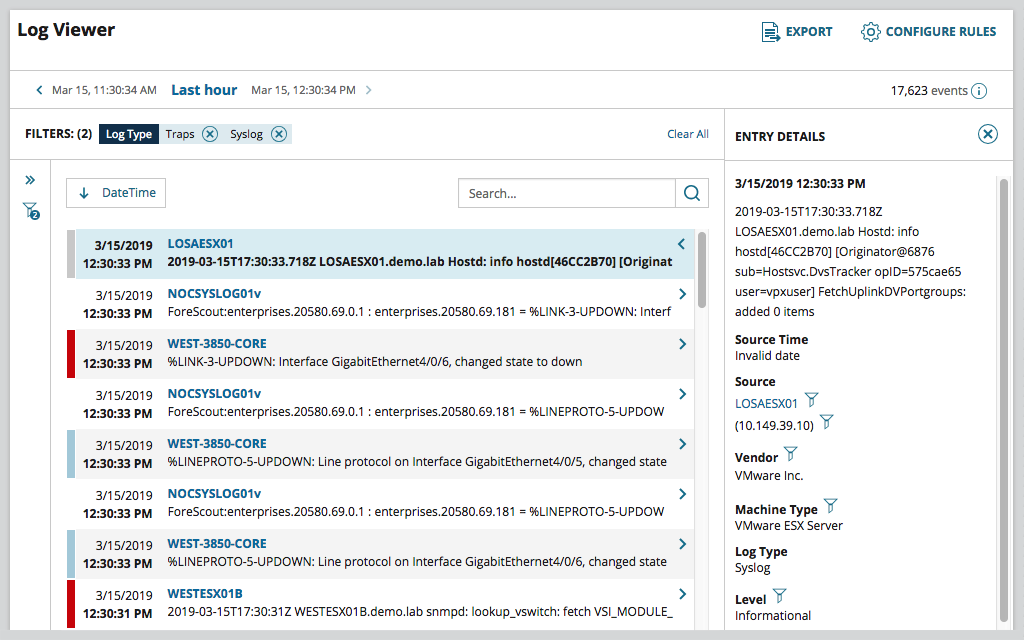
View, search, and alert on log data from the same console as NPM for free.
Use the Orion Log Viewer to collect, search, filter, and alert on syslogs and SNMP trap data from within the Orion console. NPM users can activate the functionality of Orion Log Viewer free with a trial of SolarWinds Log Analyzer. Orion Log Viewer helps you to correlate log data with performance and availability metrics on a common timeline so you can get to root cause faster. Even if your Log Analyzer trial expires, the Orion Log Viewer functionality stays activated in your NPM instance.
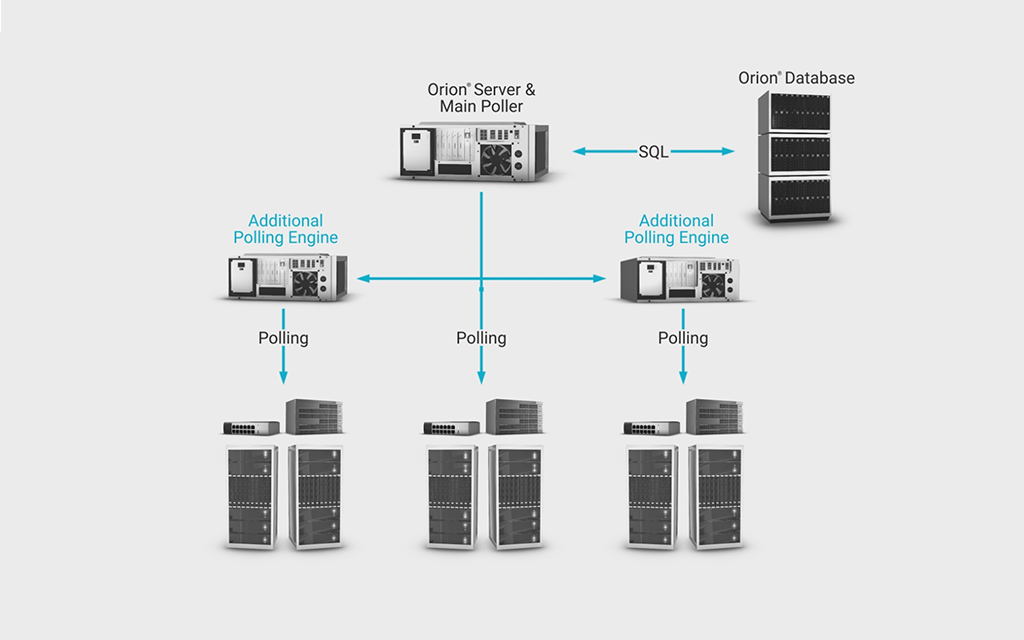
Be able to monitor more elements, poll more frequently, or cover more locations.
Gain the ability to increase frequency of polling, easily monitor remote locations, or scale to up to 12,000 additional elements per additional polling engine.
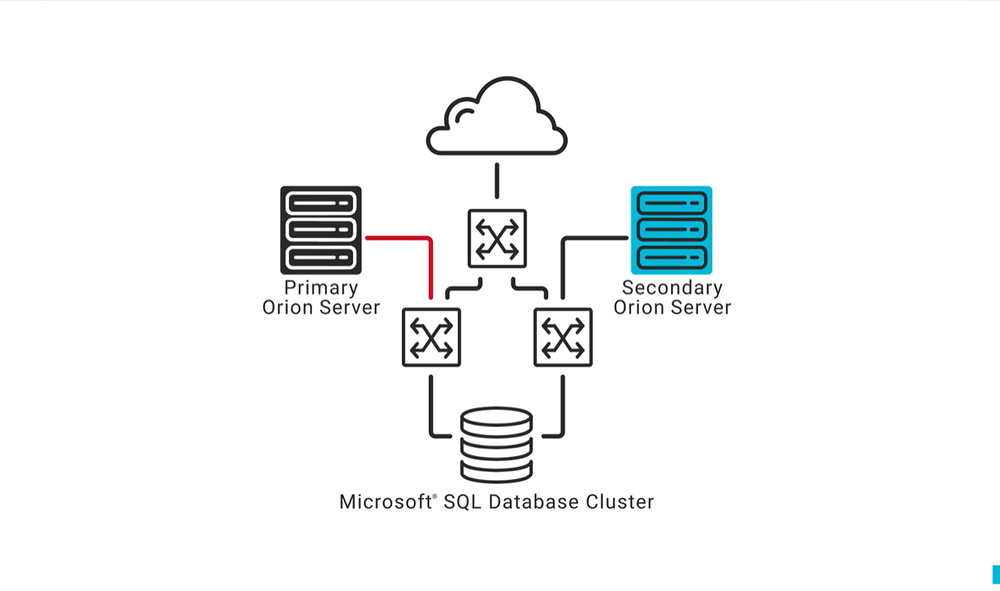
Help ensure 24/7 availability for your Orion servers and pollers across subnets with Orion Platform High Availability (HA).
Protect your monitoring environment against O/S crashes, application failures, network connectivity problems, and database availability issues with SolarWinds High Availability.
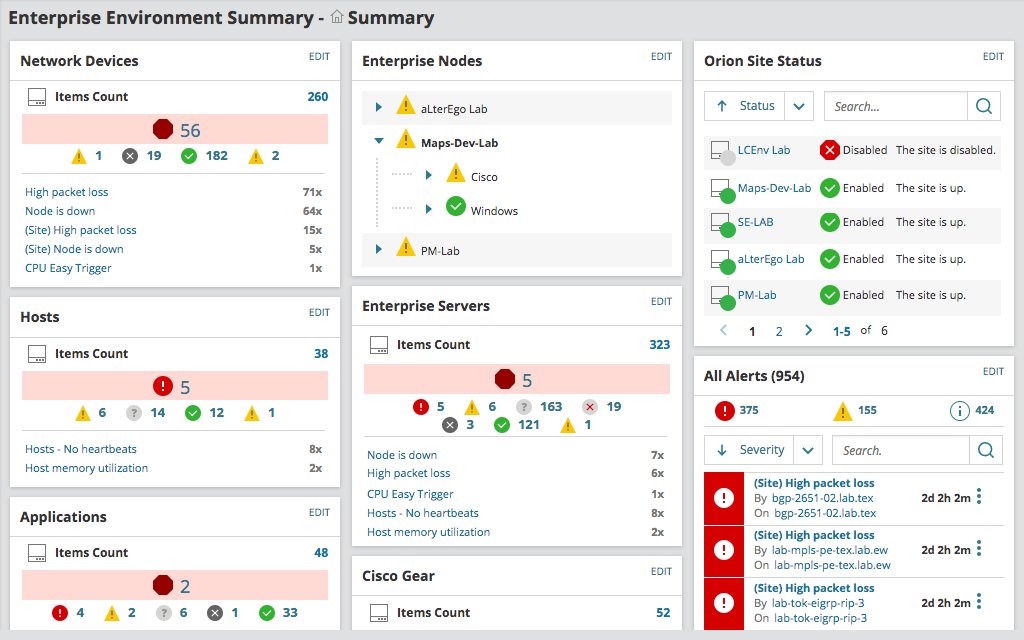
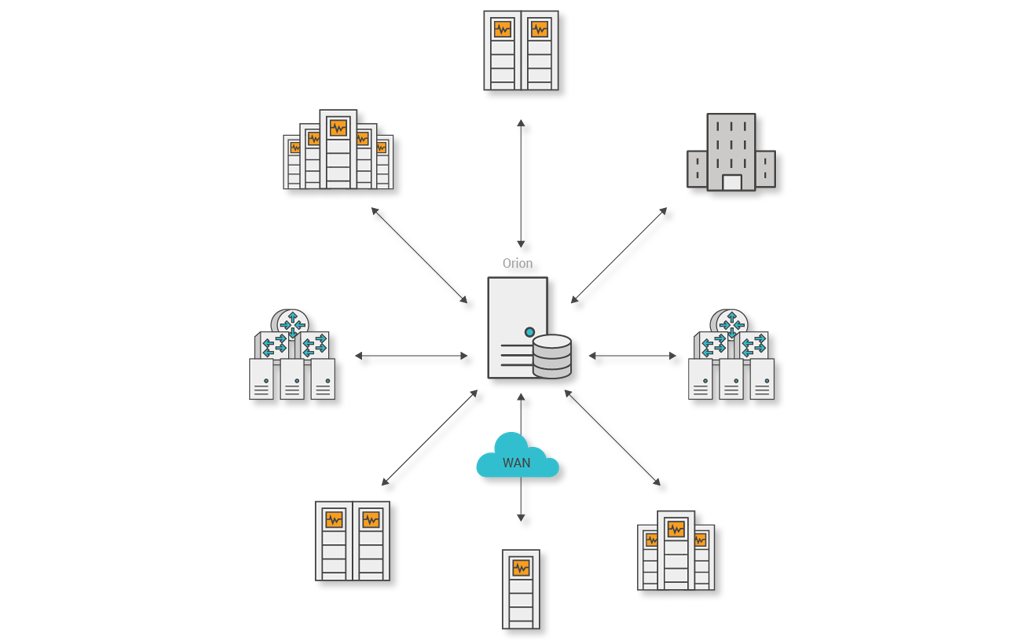
Get a single consolidated command center of multiple SolarWinds servers with Enterprise Operations Console (EOC).
SolarWinds Enterprise Operations Console collects performance data from an installed base of multiple SolarWinds servers, and summarizes this data into a composite, centralized view.
Log Analyzer:
Gain insight into the performance of your environment.
Your infrastructure is constantly generating log data to provide performance insight. Collect, consolidate, and analyze thousands of syslog, traps, Windows, and VMware events to perform root-cause analysis with log monitoring tools from Log Analyzer.
Rapid identification of performance and availability issues.
Perform searches using basic matching. Execute searches using multiple search criteria and apply filters to narrow results. Save, schedule, and export search results within the log monitoring software.
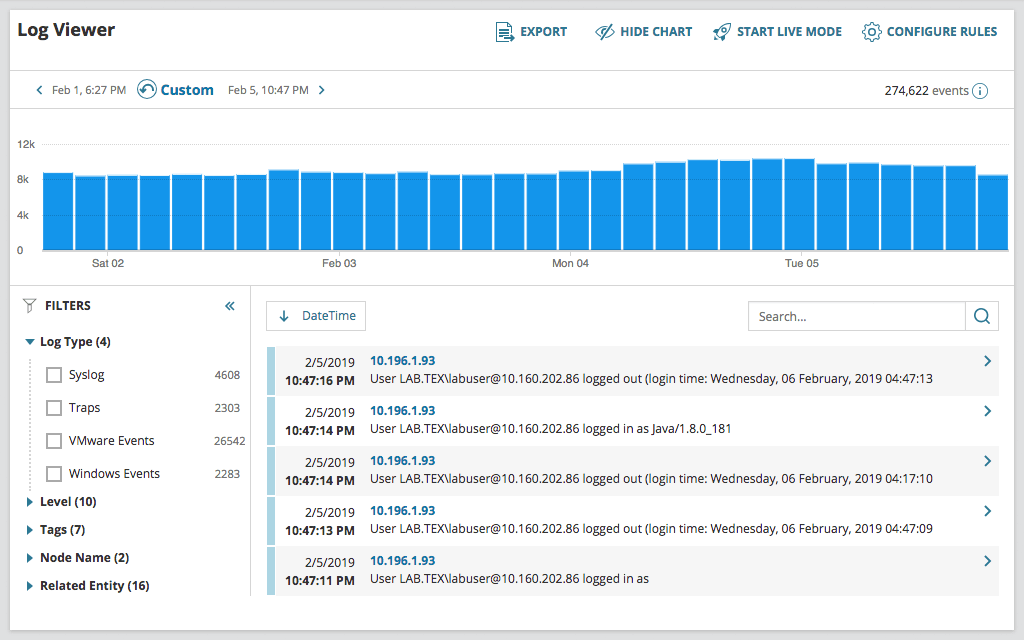
See log data in real-time with an interactive chart and graph.
Traditional log collection and log management tools generate reports in plain text or HTML. SolarWinds® Log Analyzer displays logs in an interactive, real-time log stream.
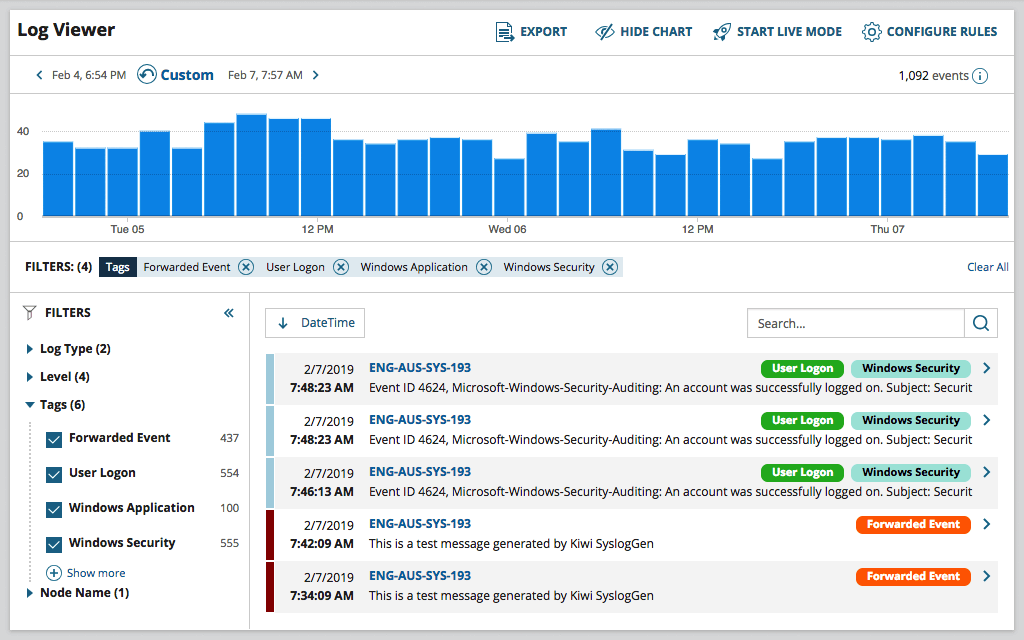
Simplified log search
Easily apply (color-coded) tags to your log data to aid with filtering, searching, and identifying performance issues.
Collect, analyze, and alert on data in Windows flat log files
Log Analyzer can collect Windows flat log files and provide insight to help admins troubleshoot and resolve application issues faster.
Unified infrastructure monitoring and centralized event log management.
SolarWinds Log Analyzer directly integrates your log and event data into the Orion Platform console so you can easily view log data alongside network and systems performance.
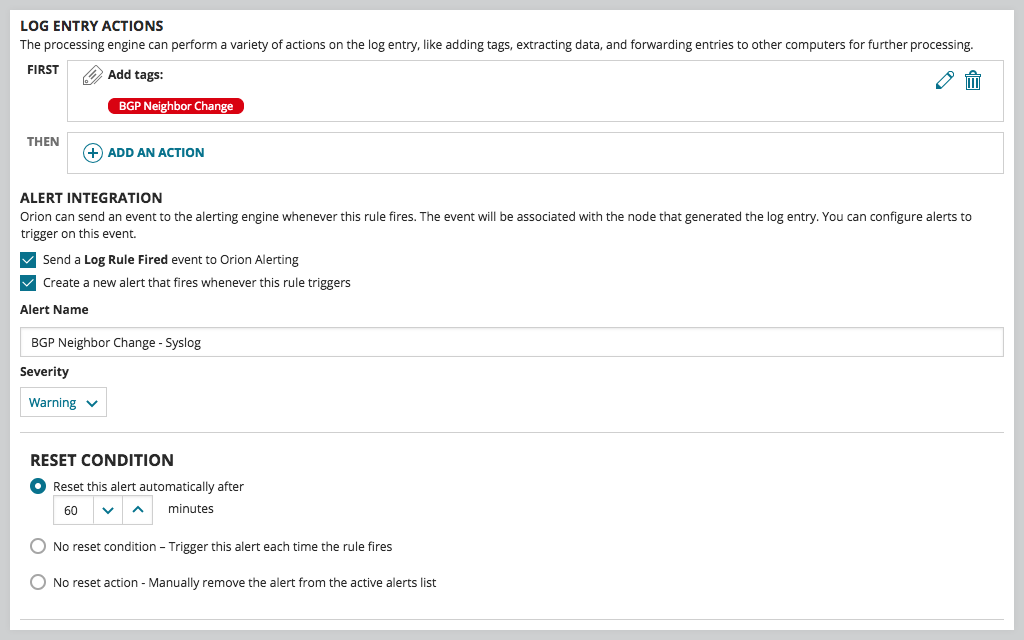
Leverage Orion intelligent alert actions
Be the first to know when issues arise. Log Analyzer integrates with the intelligent alert engine of Orion to provide customizable alerts along with delivery options including email notification, ServiceNow integration, and the triggering of an external script.
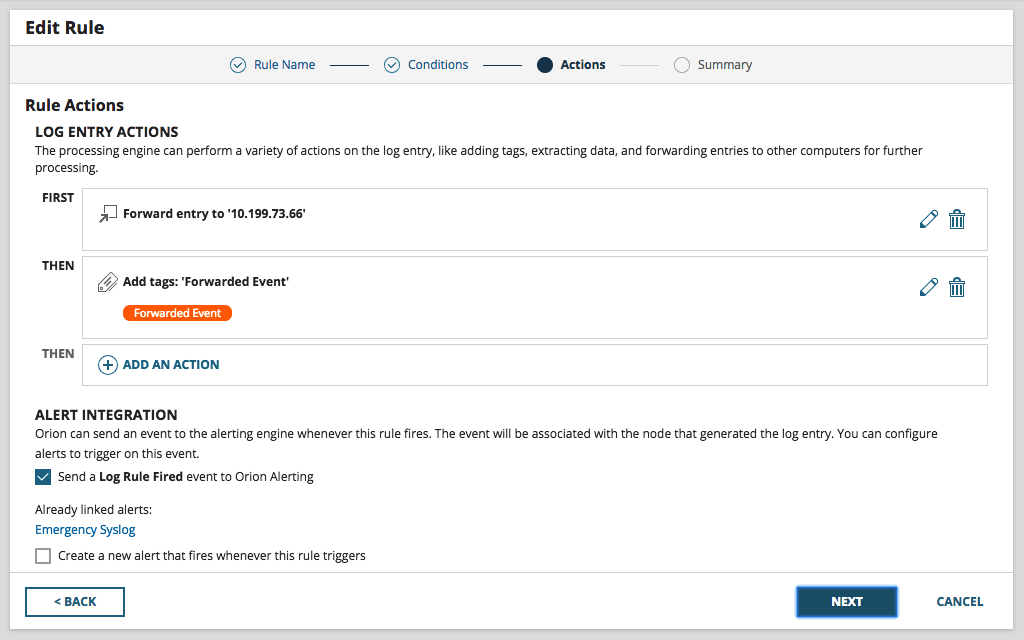
Keep your log aggregator from being a dead end
Having your log data in a central location is great for troubleshooting and correlation, but what if you need that useful data in other locations or tools? Log Analyzer allows you to forward logs to other applications, such as ticketing systems or SIEMs, and export log data to CSV files for even more flexibility.
System Requirements:
Network Performance Monitor
| Software | Minimum Requirements |
|---|---|
| Operating System |
Desktop operating systems, such as Windows 10, 64-bit Pro or Enterprise, are supported for evaluation environments only. To make a smooth transition from your evaluation to production deployment, SolarWinds recommends that you avoid installing evaluations on desktop operating systems. Support differences between Orion Agents and Orion Platform products
|
| Operating system languages |
|
| IP address version |
|
| Web server | If you are not using Windows Authentication, make sure the Anonymous Authentication is enabled for the SolarWinds NetPerfMon website. Anonymous Authentication is used with the default forms-based authentication. |
| .NET Framework | .NET 4.8 |
| Services | If you are using the Syslog or SNMP Traps feature of the Orion Platform, make sure the following services are running after installation is complete to collect syslog messages and traps:
|
| Web console browser | Orion Platform products support two most recent versions of the following web browsers available at the release date:
Orion Platform products also support the following browsers:
|
| Hardware | Minimum Requirements |
| CPU |
|
| Hard Drive |
|
| Memory |
|
| Database server (SQL Server) | Minimum Requirements |
| SQL Server | Small SL100, SL250, SL500, Medium SL2000, Large SLX
XL (Up to 400,000 monitored elements)
Recommendations
|
| SQL Server collation |
|
| CPU |
|
| Hard drive space |
|
| Memory |
|
| Authentication | Either mixed-mode or Windows authentication. If you require SQL authentication, you must enable mixed mode on your SQL server. |
| Other software | SolarWinds recommends you install the SQL Server Management Studio component on your Orion database server.
The Orion Installer installs the following required x86 components if they are not found on your Orion database server:
|
Log Analyzer
| Type | Requirements |
|---|---|
| LA Database | Physical server or virtual machine Quad core processor or better 16GB RAM 1 x 1 Gb dedicated NIC Windows Server 2016 or 2019, Standard or Datacenter Edition Disk requirements: 100 – 130GB/day (@1000 EPS) on local NTFS disk Microsoft® SQL Server® 2016 SP1 or later Supported collations: English with collation setting SQL_Latin1_General_CP1_CI_AS English with collation setting SQL_Latin1_General_CP1_CS_AS |
| LA/Orion Server | Quad core processor or better Required: 4 cores Recommended: 8 cores HDD: 15GB minimum, 40GB recommended Memory 8GB minimum 16GB recommended |
| Software | Minimum Requirements |
| Operating System | Windows Server 2016, 2019 |
| Operating System Language | English (U.K. or U.S.) |
NOTE: The minimum server requirements listed assume default configuration. Significantly increasing the poll rate or statistic collection rate could result in additional load on the server, which may require a larger CPU or additional memory.
Documentation:
Download the Solarwinds Network Performance Monitor Datasheet (.PDF)
Download the Solarwinds Log Analyzer Datasheet (.PDF)
Get in touch with a Solarwinds Solutions Specialist today to Learn More!