
Solarwinds Systems Management Bundle
Complete systems monitoring built on the Orion Platform
Overview:
SolarWinds Systems Management Bundle delivers visibility across your systems environment—from applications to servers, virtualized infrastructure, and storage systems— to help you diagnose and troubleshoot performance problems faster. Systems Management Bundle combines the goodness of four products from SolarWinds—all integrated to deliver single-pane-of-glass visibility on the SolarWinds Orion Platform.
The Systems Management Bundle consolidates monitoring insight from all four products and presents data in the form of an intuitive application dependency map, allowing you to visualize relationships between applications and underlying IT infrastructure components.
- Application and dependency monitoring
- Detailed visibility from application to spindle
- Automatic application and infrastructure discovery
- Supports hybrid cloud environments
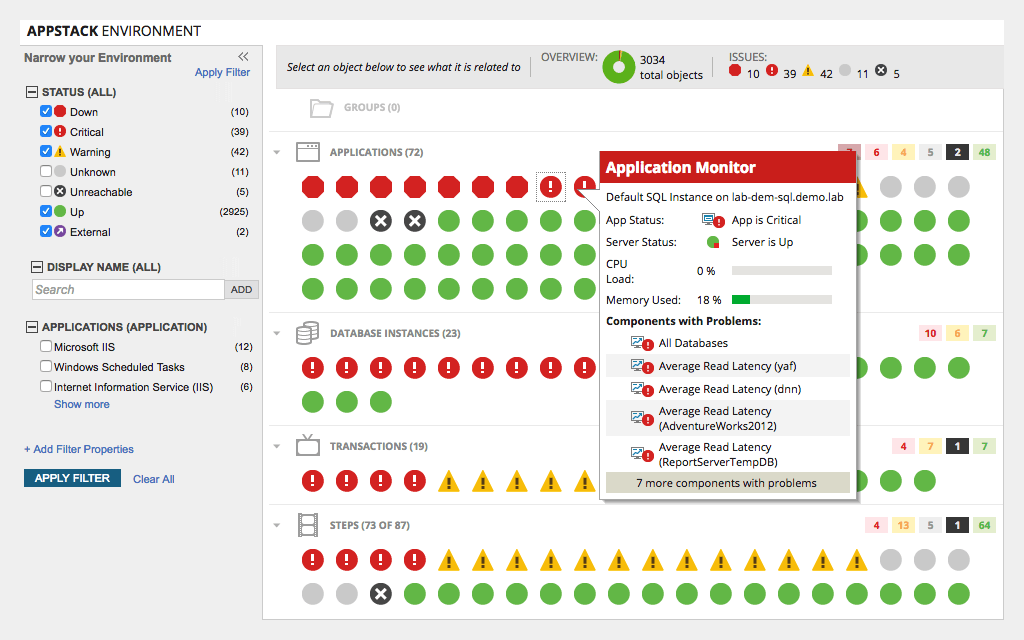
- The AppStack dashboard provides application dependency and status
- The PerfStack™ dashboard allows for drag-and-drop performance correlation
At A Glance
The Systems Management Bundle provides:
- End-to-end visibility across various technology silos
- Support for multiple technology vendors
- Pre-built integration, including automated and contextual visibility that extends management across apps, database, server, virtual layer, and storage infrastructures
- Quick and easy setup and customization; add the dashboard to your NOC view in no time
What the Systems Management Bundle Includes
Server & Application Monitor
Comprehensive server and application monitoring made simple
- Get started typically in minutes
- Monitor Azure and AWS IaaS, PaaS and SaaS
- 1200+ application monitoring templates
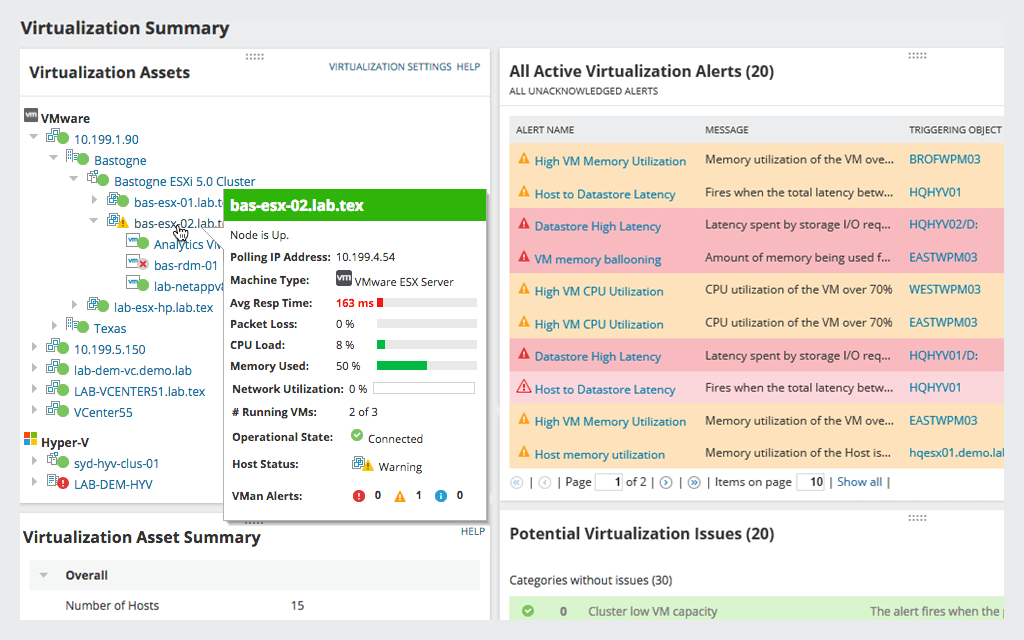
Virtualization Manager
Virtual machine monitor designed to optimize performance and fix issues in minutes
- Comprehensive virtualization management
- VM recommendations
- VM sprawl control
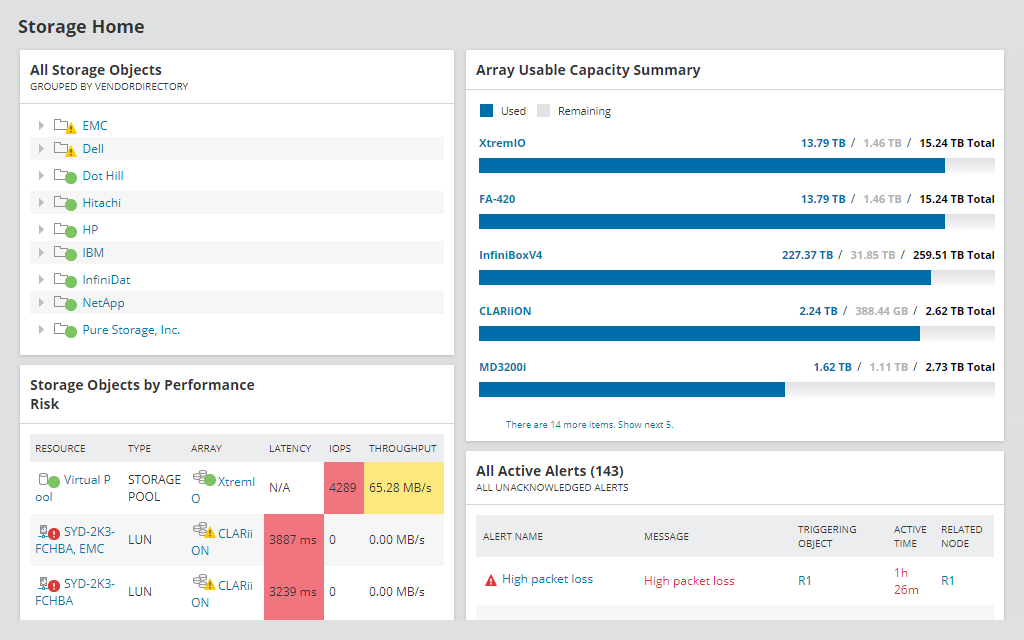
Storage Resource Monitor
Storage management software built with multi-vendor performance monitoring
- Multi-vendor storage monitoring
- Performance and capacity planning
- Alerting and hotspot detection
Web Performance Monitor
Website monitoring software built to find and fix internal and external site and app performance issues
- Complete performance monitoring
- Continuous synthetic transaction monitoring
- Detailed load time metrics
Features:
Appstack and Perfstack Dashboard Differentiators
The AppStack and PerfStack dashboards work together help to pinpoint and correlate application and system performance bottlenecks. The AppStack dashboard dynamically links applications and its dependent infrastructure highlighting node status. The PerfStack dashboard expands upon AppStack by allowing you to drag, drop, chart, and correlate these application and infrastructure nodes in a single timeline. Using a timeline slider, you can go back in time to identify patterns and help define what’s normal. Networking nodes can also be added for performance analysis while using the PerfStack dashboard.
Server & Application Monitor
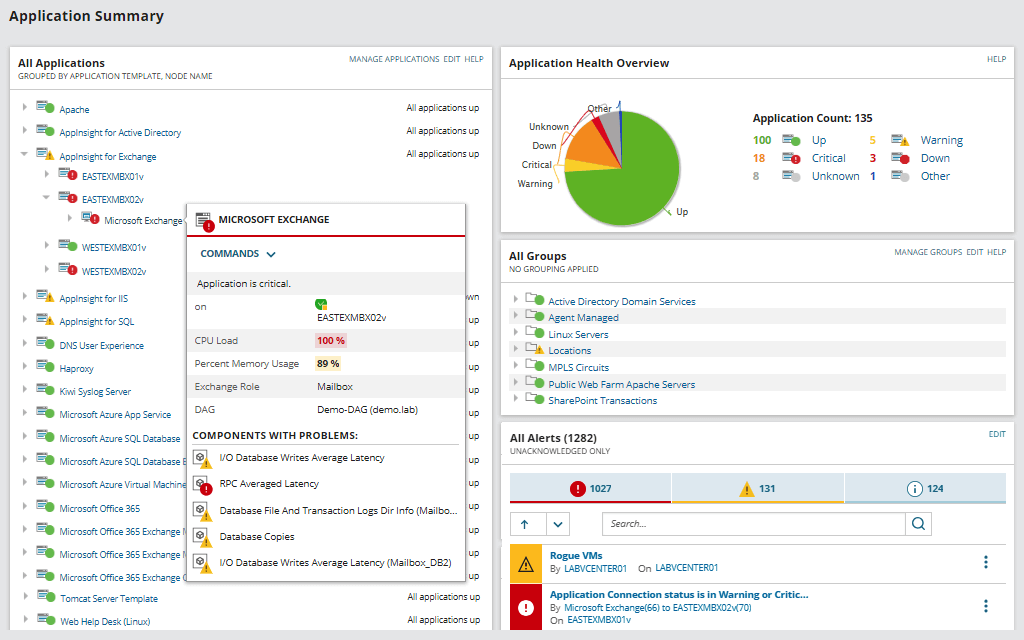
Comprehensively monitors the health and status of multi-vendor server hardware and hundreds of applications out-of-the-box including SQL Server, Exchange, IIS, Active Directory, Office 365, and more.
- Proactively manage IT hardware and software assets with built-in IT asset management capabilities
- Monitor the availability, high-level CPU, and memory of VMware and Hyper-V hosts and virtual machines to provide basic statuses
- Support hybrid IT environments with built-in AWS infrastructure monitoring and the ability to deploy into cloud provider via agent or agentless deployment
Virtualization Manager
- Performance monitoring, capacity planning, configuration, VM sprawl detection, VDI, and chargeback for troubleshooting and optimizing a VMware or Hyper-V environment
- Alerts about configuration issues and performance problems across virtual clusters, hosts, and datastores
- Uses baseline thresholds to alert on performance discrepancies on clusters, hosts, VMs, and datastores
- Actionable intelligence provides recommendations for optimal server performance and placement
Storage Resource Monitor
- Real-time storage performance visibility into heterogeneous SAN and NAS arrays
- Storage monitoring capabilities for LUNs, disks, storage pools/RAID groups, storage arrays
- Comprehensive alerting and reporting capabilities for reporting on configuration and asset information, storage grouping, etc.
- Multi-vendor array support for most major storage vendors including EMC, NetApp, Dell, and LSI arrays
Web Performance Monitor
- Monitoring of user experience and overall performance of websites and web applications
- Detailed information about website load times, front-end components, user experience for complete transactions, page load speeds by location, heavy page elements, etc.
- Agentless user experience testing from multiple locations inside or outside your firewall
System Requirements:
Server & Application Monitor
| Hardware | Minimum Requirements |
|---|---|
| CPU | Quad core processor or better |
| Memory | 6GB |
| Hard Drive | 20GB minimum |
| Software | Minimum Requirements |
| Database | On-premises SolarWinds supports Express, Standard, or Enterprise versions of the following:
Cloud Amazon RDS |
Virtualization Manager
| Hardware | Minimum Requirements |
|---|---|
| CPU | 3.0GHz quad-core |
| Memory | 8GB + RAM (Recommendations feature requires an additional 8GB) |
| Hard Drive | 20GB (up to 3,000 virtual machines) 30GB (up to 6,000 virtual machines) 10GB free disk space |
| Software | Minimum Requirements |
| Operating System | Windows Server 2016 or later |
| Database | Azure SQL Database SQL Server 2014, 2014 SP1 SQL Server 2016 or 2016 SP1 SQL Server 2017 |
| .Net Framework | NET 4.8 |
| Web Browser | Microsoft Internet Explorer version 11 Microsoft Edge Mozilla Firefox last two versions Google Chrome last two versions |
Storage Resource Monitor
| Hardware | Minimum Requirements |
|---|---|
| CPU | Quad core processor or better |
| Memory | 6GB |
| Hard Drive | 20GB minimum |
| Software | Minimum Requirements |
| Operating System | Windows Server 2016 or later |
| Database | On-premises
SolarWinds supports Express, Standard, or Enterprise versions of the following:
Cloud Amazon RDS |
Web Performance Monitor
| Hardware | Minimum Requirements |
|---|---|
| CPU | Quad core processor or better |
| Memory | 6GB |
| Hard Drive | 20GB minimum |
| Software | Minimum Requirements |
| Operating System | Windows Server 2016 or later |
| Database | On-premises
SolarWinds supports Express, Standard, or Enterprise versions of the following:
Cloud Amazon RDS |
Screenshots:
Server & Application Monitor
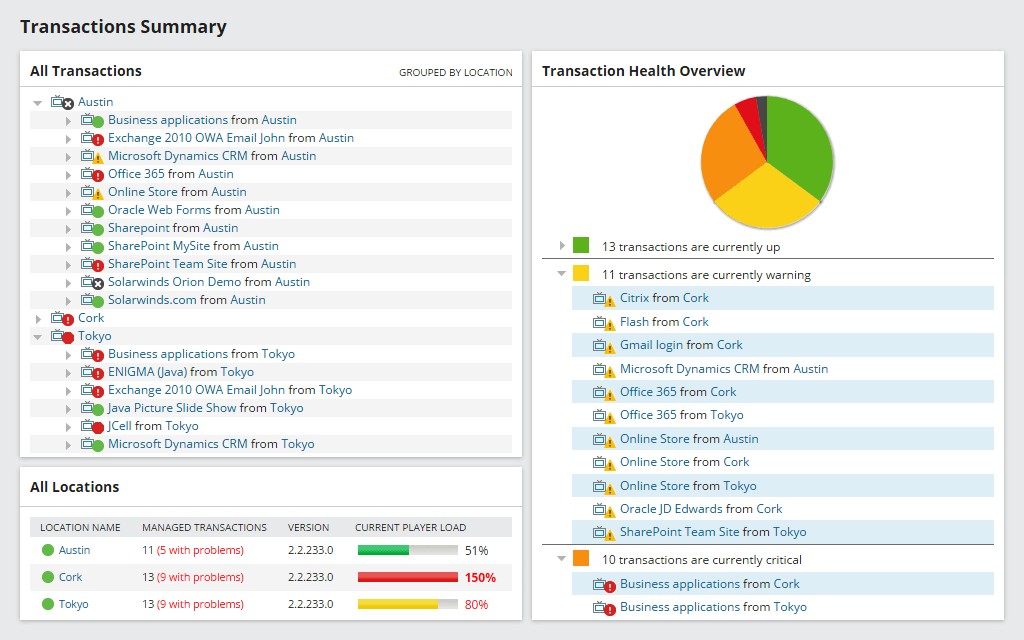
Automatic application discovery and server monitoring.
Download, install, automatically discover your environment, and start monitoring in about an hour with help from SAM's simple server monitoring tool. No professional services required.
Quickly monitor the performance and availability of Microsoft Azure and Amazon AWS services.
Monitor the IaaS, PaaS, and SaaS services for Amazon Web Serices (AWS) and Microsoft Azure. Provide end-to-end systems performance and application monitoring using agent and agentless-based technologies for application, systems, and service metrics.
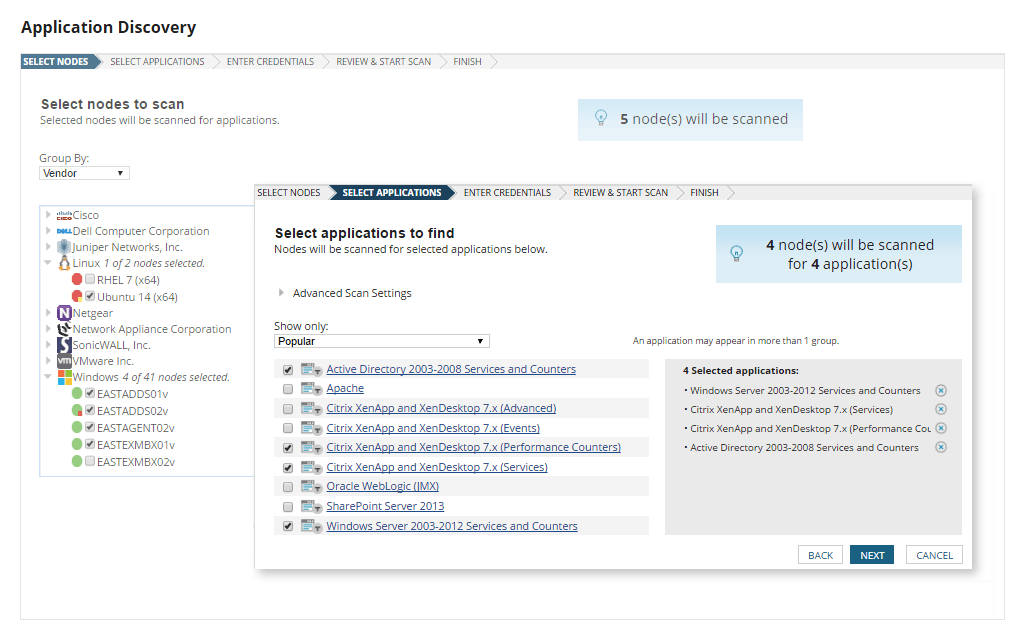
Built-in templates provide best practices.
Systems and application performance monitoring and troubleshooting templates for 1,200+ supported applications, systems, and infrastructure such as:
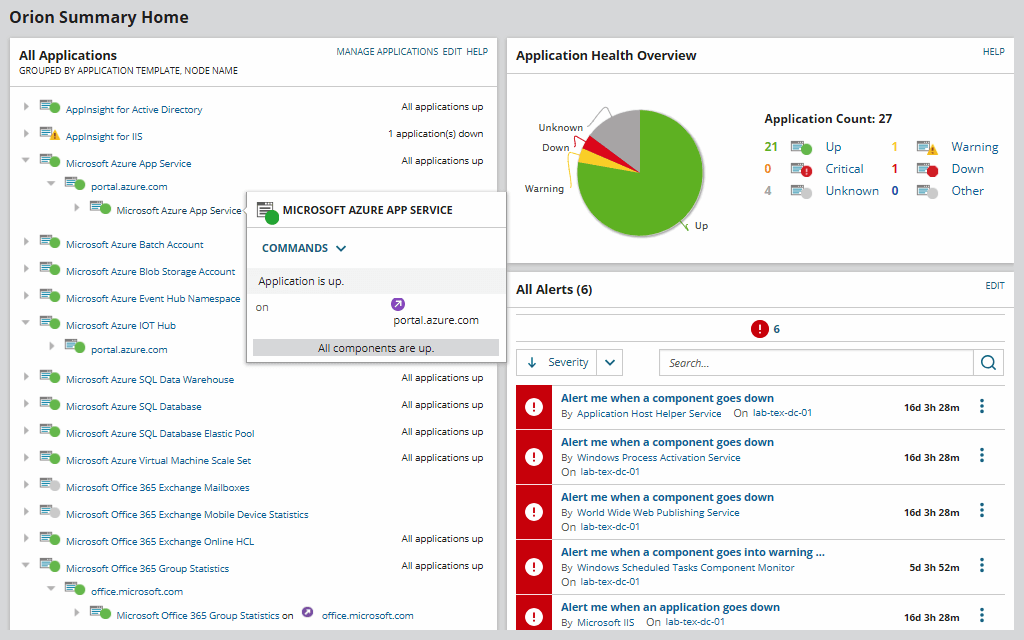
- Get more in-depth application monitoring with AppInsight™ dashboards for Active Directory, Exchange, Microsoft IIS, and SQL Server.
- View code-level application performance level detail with Application Performance Monitor integration.
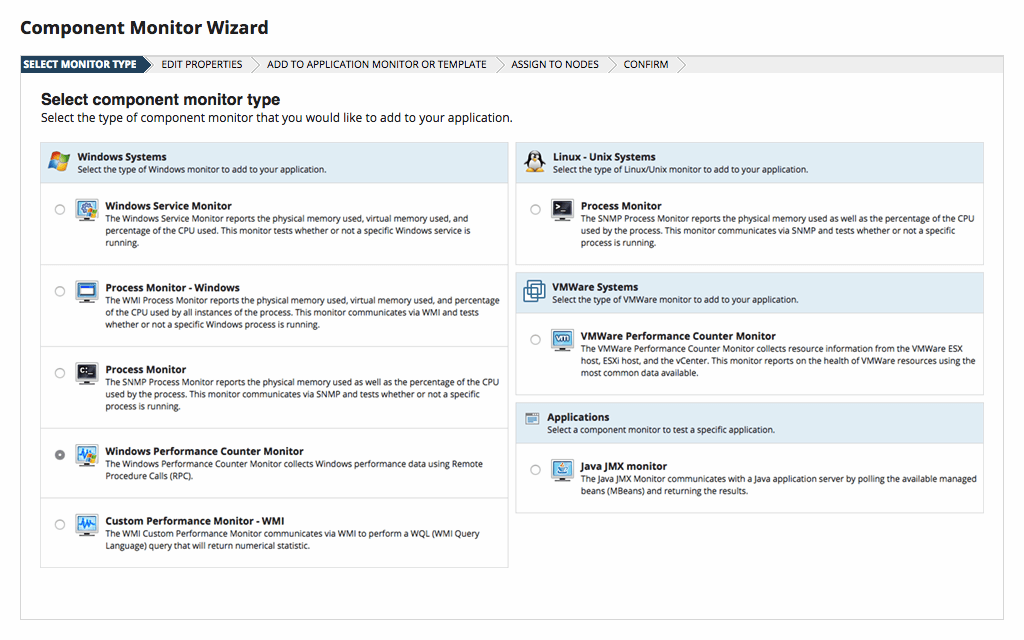
Extensive customization gives you the power to monitor what and how you want.
Create custom monitors, modify built-in templates, and import your existing custom scripts in just a few clicks. We know that every IT environment is different, which is why SAM server monitoring is designed to allow you to monitor any service, process, or application, regardless of whether it’s a commercial or a custom application.
Virtualization Manager
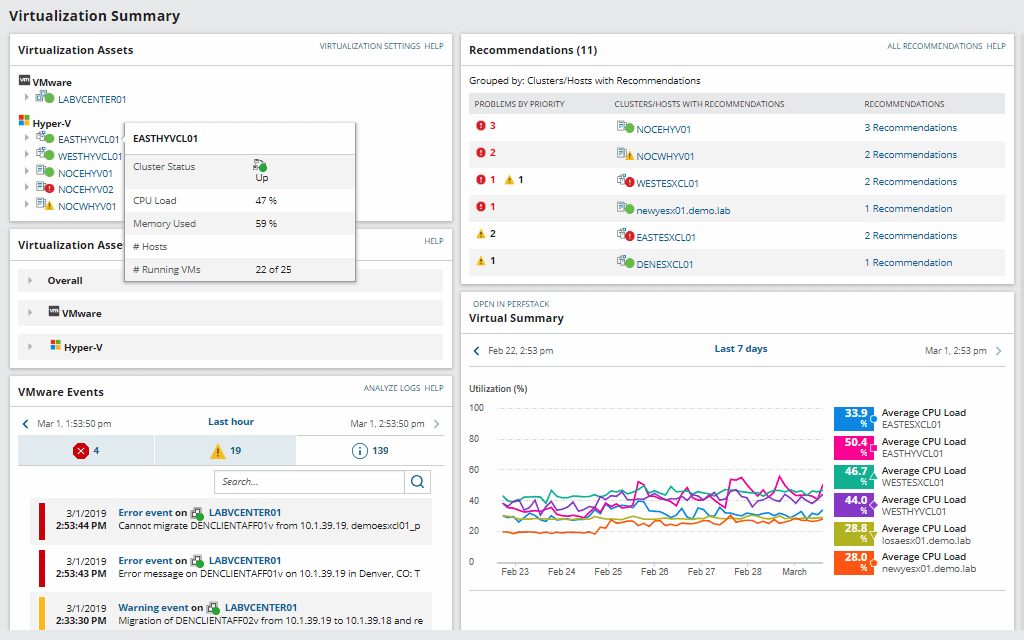
Resolve issues with a single click
Gain insight into the performance, capacity, and usage of your virtualized infrastructure, including hosts, VMs, clusters, containers, vSANs, and other datastores. VMAN's VM monitoring software can help remediate virtual machine issues with built-in management actions without needing to log in to a hypervisor.
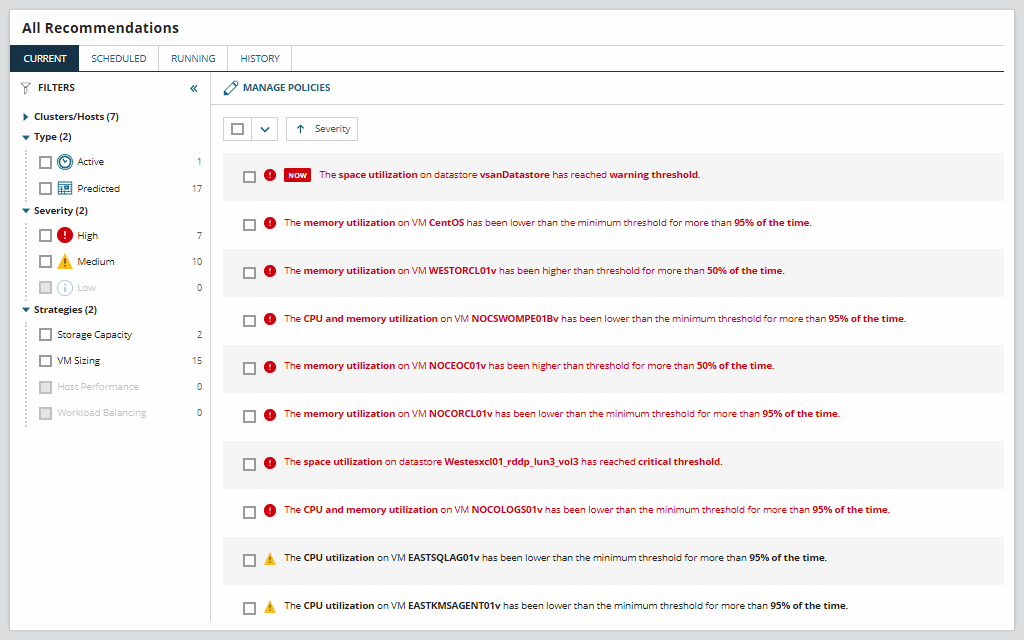
Recommendations for optimal VM size and placement.
Actionable Intelligence can allow for single-click remediation of active and predicted recommendations to optimize virtual machine performance and resource allocation. Recommendations can be individually selected or multi-selected to be run immediately or scheduled to run at a later date and time.
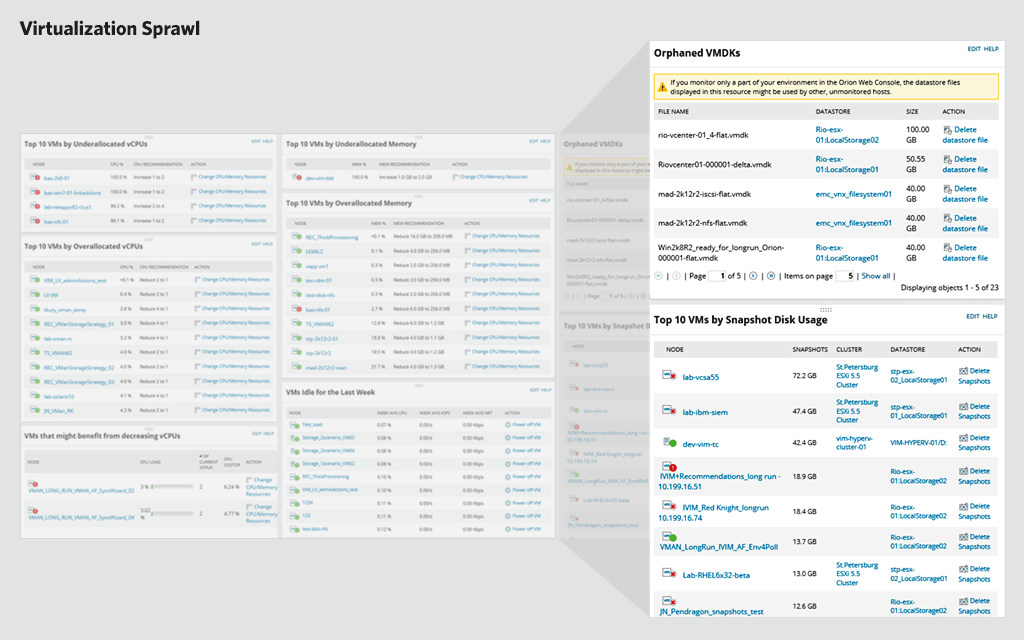
Reclaim resources back into the virtual pool.
Power off idle VMs and delete powered-off VMs, orphaned VMDK files, and snapshots to reclaim resources with Virtualization Manager’s VM sprawl control management tool.
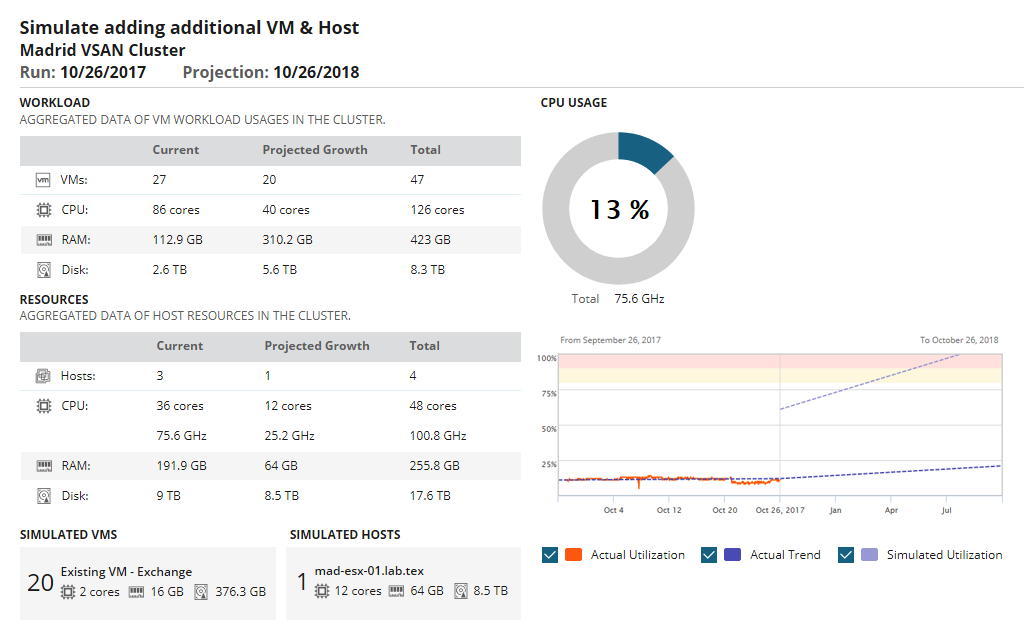
Virtual machine performance monitoring and resource planning.
Predict CPU, memory, network, and storage needs for VMware vSphere and Microsoft Hyper-V. Run modeling scenarios to learn how best to support new workload, or run a checkup to ensure your resources are in alignment with current usage.
Storage Resource Monitor
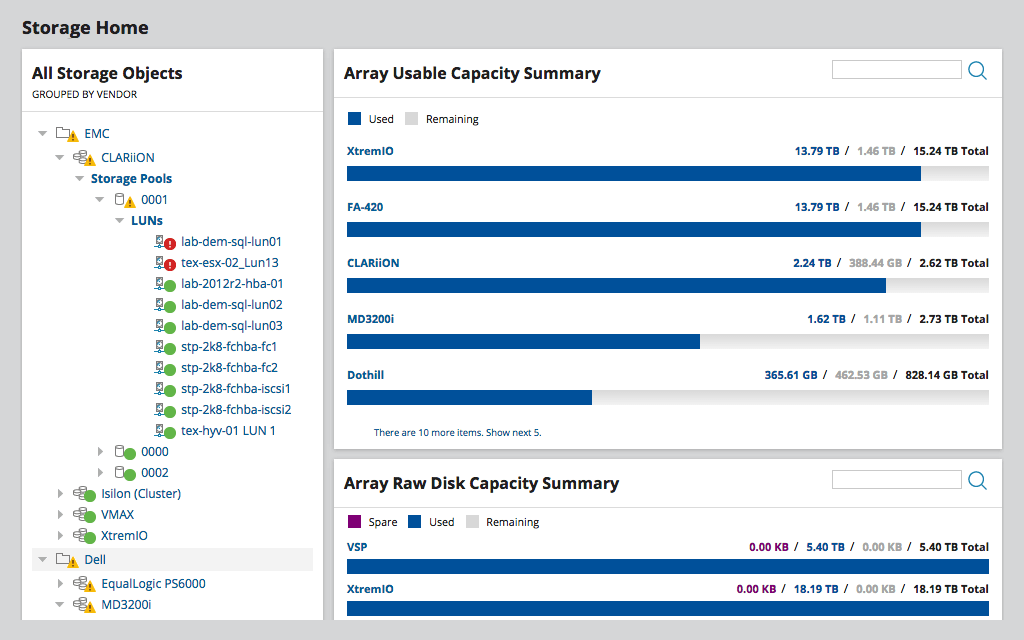
Monitoring for multi-vendor storage arrays from EMC, NetApp, Dell, and others.
Comprehensive storage resource management tools can provide performance monitoring and alerting across all your storage arrays to help ensure peak performance and avoid capacity surprises.
Real-time NAS and SAN performance monitoring capacity planning.
Storage Resource Monitor (SRM) can help identify performance problems quickly before they affect your application performance. The storage monitoring software can also provide a clear picture into each layer, array, pool, and LUN/Volume to see storage capacity growth and when space will run out.
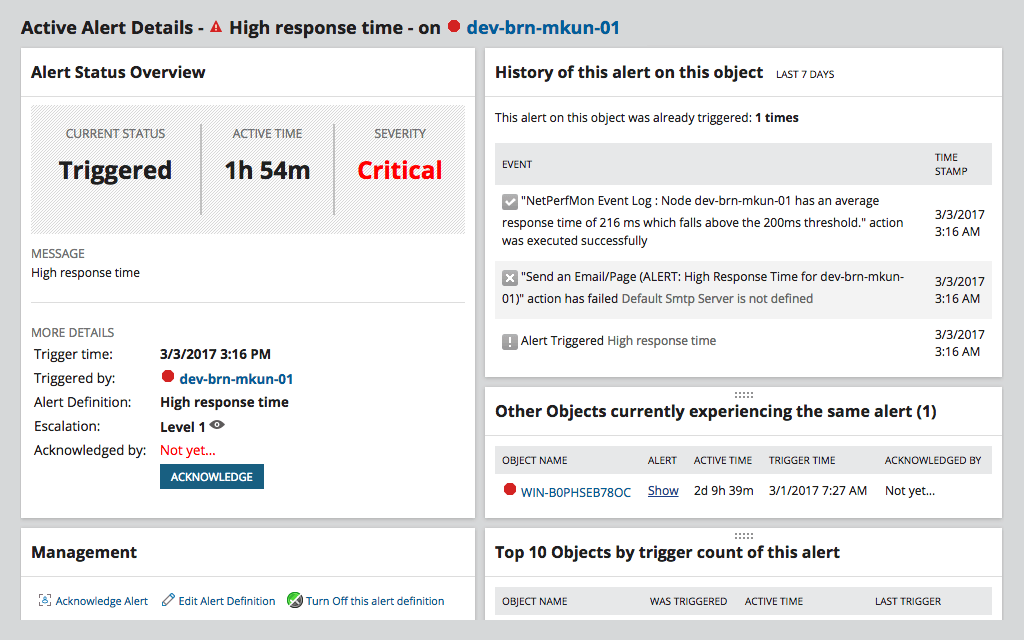
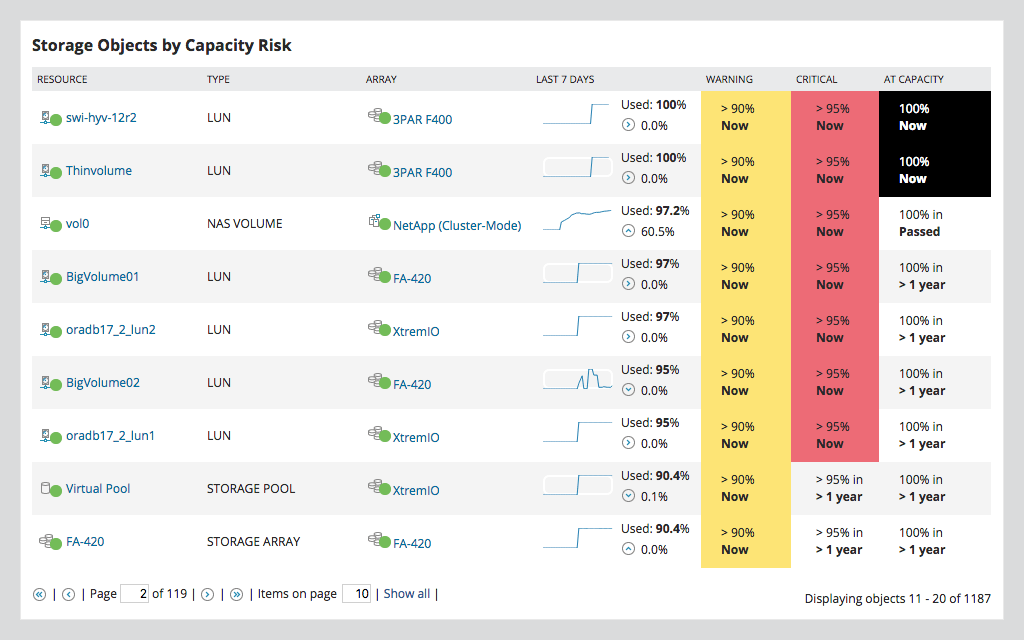
Get notified about issues with your devices, LUNs, storage pools/RAID groups, CIFS shares, and more.
Know about network storage performance problems with easy-to-use alerts and customizable thresholds. Storage Resource Monitor can quickly identify IOPS, throughput, and latency hotspots inside storage devices to identify overworked resources.
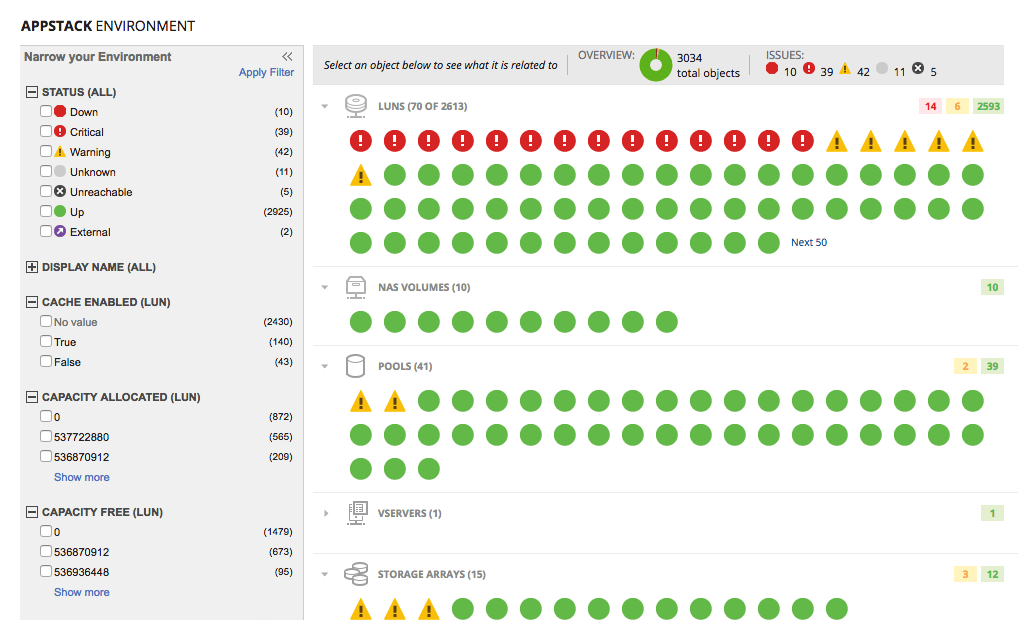
Instant visibility of all storage layers, extending to virtualization and applications.
SRM storage monitoring tool can provide visibility into performance problems, including every layer of your infrastructure, and expandable to see the VMs and applications that are dependent on any storage element.
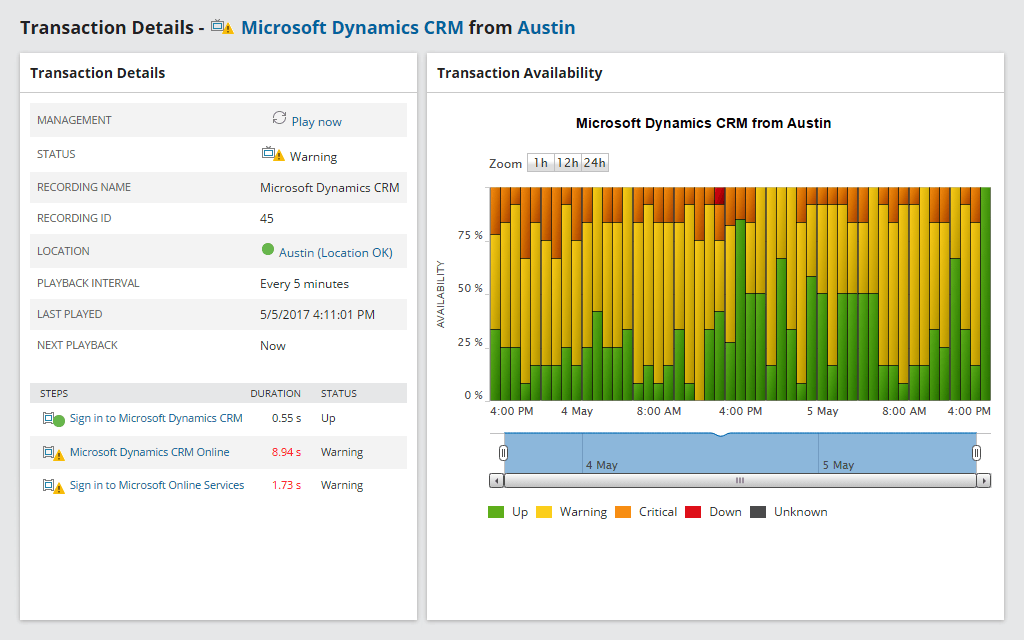
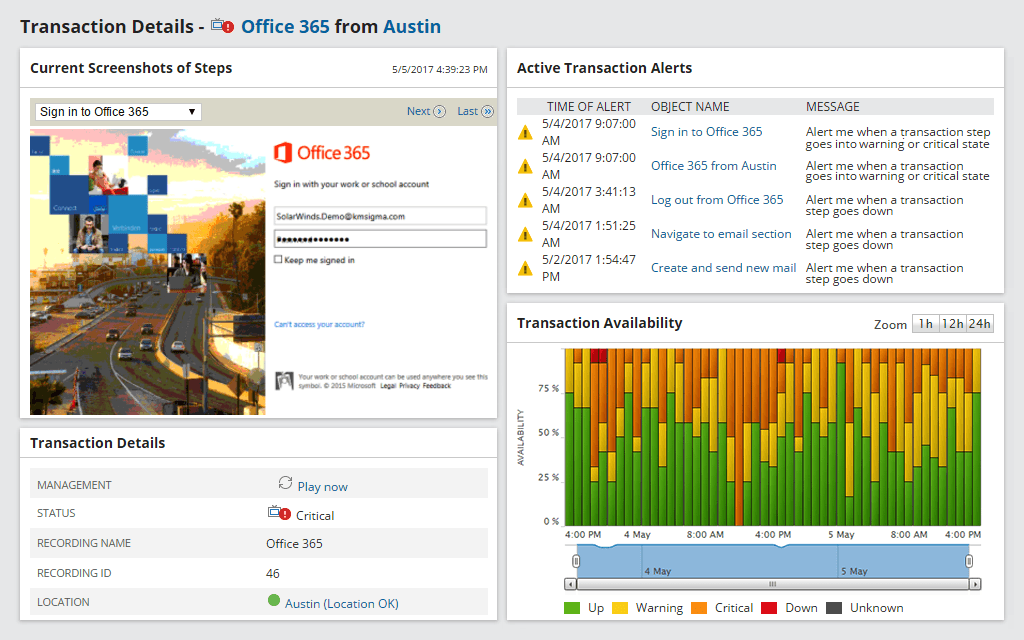
Web Performance Monitor
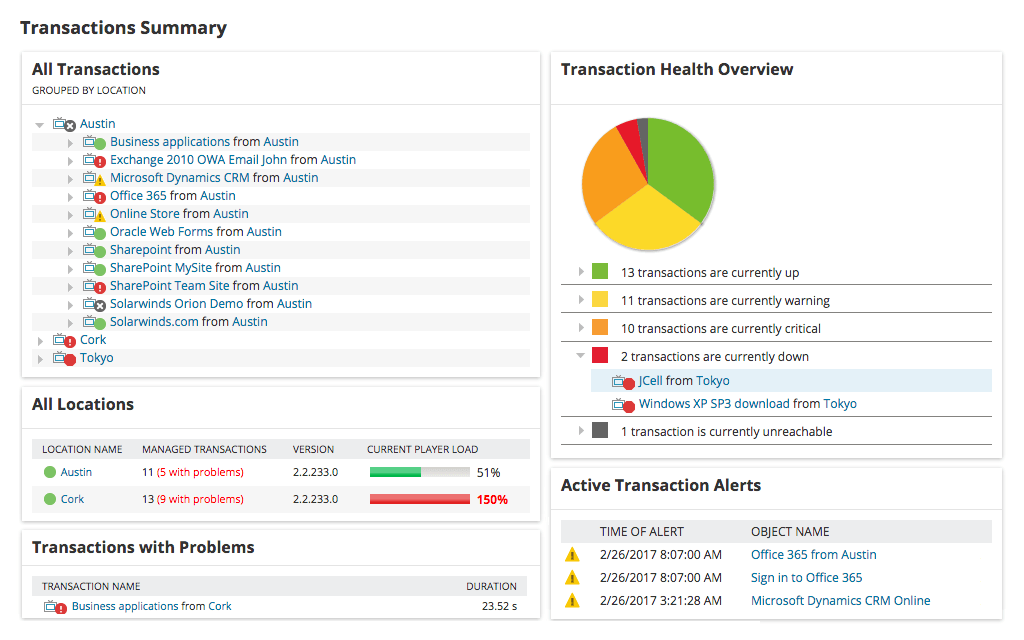
Monitor web and SaaS application performance.
Know if slow web services are affecting user experience with SolarWinds Web Performance Monitor (WPM) website monitoring tools.
Experience your app like a user.
Record and run critical transactions as frequently as every five minutes.
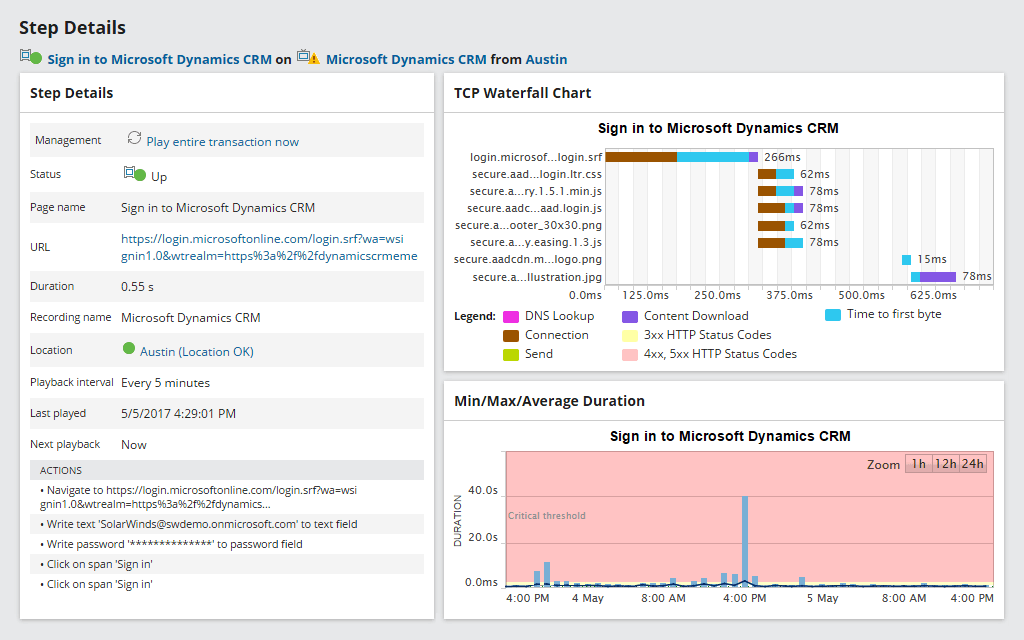
Know how long your users are waiting.
Identify and resolve slow webpage elements that affect overall performance. WPM web monitoring software can help diagnose latency issues.
Enhanced text matching capabilities for synthetic end-user monitoring
Expand synthetic end-user monitoring capabilities by matching any regular expression (regex) to an entire line or a block of complete lines.
Documentation:
Download the Solarwinds Systems Management Bundle Datasheet (.PDF)
Get in touch with a Solarwinds Solutions Specialist today to Learn More!