
Solarwinds Loggly
Cost-effective, hosted, and scalable full-stack, multi-source log management solution
Overview:
With infrastructure and application environments spanning on-premises, hybrid, and public cloud environments, IT operations, application, and SRE teams are inundated with unrelated events, issues, and logs. Every outage or slowdown directly impacts the business, either in lost productivity or lost revenue. Issues must be diagnosed rapidly and resolved across all the dynamically changing components underpinning your heterogeneous web applications, services, and infrastructure.
SolarWinds Loggly is a cost-effective, hosted, and scalable full-stack, multi-source log management solution combining powerful search and analytics with comprehensive alerting, dashboarding, and reporting to proactively identify problems and significantly reduce Mean Time to Repair (MTTR).
Use Cases
How do I rapidly triage cross-stack issues?
Quickly jump from alerts or metrics into relevant logs to rapidly spot issues
How can I share common insights?
Collaborate with all stakeholders via easy-to-use and customized dashboards and visualizations
How do we keep up with constant growth?
Scale to massive data ingest volumes with flexible data retention and always have all data needed.
Loggly At A Glance
- Full-stack, multi-source log aggregation, log monitoring, and data analytics
- Log analytics show events in context, highlight patterns, and detect anomalies for deeper insights
- Highly scalable to ingest massive data volumes and help enable quick searching across large and complex environments
- Spot usage patterns with application, service, and infrastructure-aligned historical analysis of user, log, and infrastructure data
- Manage by exception by identifying variations from normal with powerful log formatting and analytic search capabilities
- Accelerate troubleshooting with out-of-the-box metrics and dashboards, broad language support, and contextualized searching and live tail across logs and data
- Combine metrics, traces, and logs together to enhance observability and accelerate troubleshooting with tight integration between SolarWinds AppOptics™ and Loggly
Features Overview
Achieve unified log monitoring and analysis for everything that matters.

Always available, quick to repair
Ensure applications, services, and associated infrastructure deliver the utmost availability by rapidly pinpointing and communicating root cause.

Continuous insight everywhere
Rapidly achieve continuous, proactive insight for issues spanning AWS, Azure, and hybrid cloud applications, services, and infrastructure stacks.

Scalable technology for your scaling business
Enable your IT operations to grow smarter as your infrastructure, application, and service environments dynamically scale.
Features:
 Highly responsive search at scale
Process large volumes of data to quickly search across large and complex environments to see interconnected services, events, and issues.
Interactive shareable dashboards
Easily build dashboards to monitor application health, behavior, and trends, or use one of our prebuilt dashboards to monitor performance indicators (KPIs) and statistics. Send dashboards to anyone via email or collaboration systems like HipChat or Slack.
Anomaly detection and alerts
Loggly learns the normal patterns in your log data and shows deviations, so you can discover unexpected or suspicious events before they turn into problems. Create alerts based on search patterns, thresholds for specific log metrics, or other conditions.
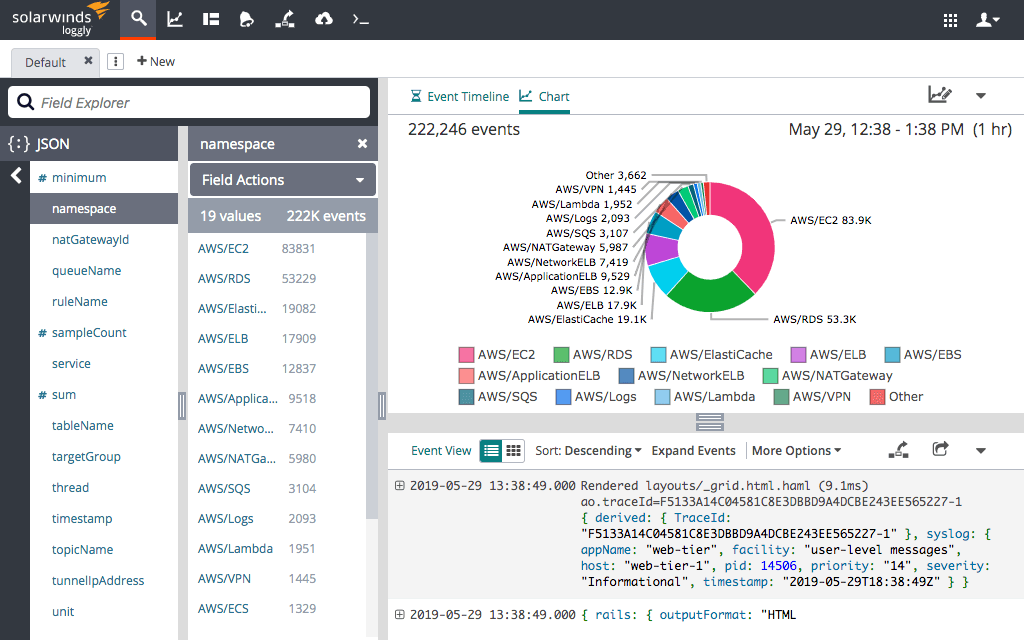
Dynamic Field Explorer
The hardest problems to fix are the ones you least expect to happen. The Loggly Dynamic Field Explorer™ automatically analyzes and pre-summarizes your log data as it’s received to let you gain insight before setting up a single query. Spot unusual event counts or outliers and drill down into the relevant data with a few mouse clicks.
Rapidly pinpoint bottlenecks and failure points
Using surround search capabilities—see events in operational context across all aggregated logs.
Collaborate with all stakeholders
Loggly provides easy-to-use and customizable dashboards and visualizations of aggregated data across the stack.
Shared agent collects metrics and logs
Spend less time setting up and start troubleshooting faster with a common intelligent agent (shared with SolarWinds AppOptics) that provides a new way to collect logs from custom applications, filter those log files, and collect metrics.
Integrated With AppOptics
Achieve maximum observability with time-series infrastructure and application performance data integrated with your log management. SolarWinds® AppOptics™ automatically appends a unique trace ID to log lines associated with a specific trace for simple, fast troubleshooting – from application performance to related log events. The integration also provides trace context in SolarWinds Loggly® by searching on the trace ID from a log line you’re interested in and getting log lines associated with the trace ID in your search results. The result? Significantly reduced application performance troubleshooting time.
Challenges Addressed:
- Rapidly triage infrastructure and application issues across the stack to pinpoint true root cause and ownership—speeding MTTR and helping prevent issues before they affect users or cause costly downtime.
- Achieve the insights required to deliver the data that matters to IT operations, DevOps, and the business across disparate sources of machine data. Enable the shared understanding required across the organization to reduce, and proactively prevent, customer-impacting disruptions and outages.
- Be confident your log management tool and process will scale with your business, providing visibility into all layers of your application and service environment while integrating with your existing IT operations procedures.
- Maximum observability through tight integration with Infrastructure and Application Performance Monitoring (powered by SolarWinds AppOptics) functionality.
Screenshots:
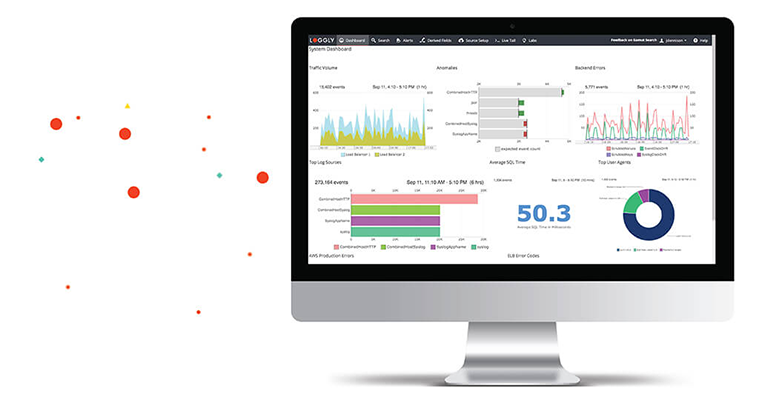
Rapidly diagnose across the stack to reduce MTTR.
Reduce MTTR by quickly jumping from an alert or metric into the relevant logs to rapidly spot issues.
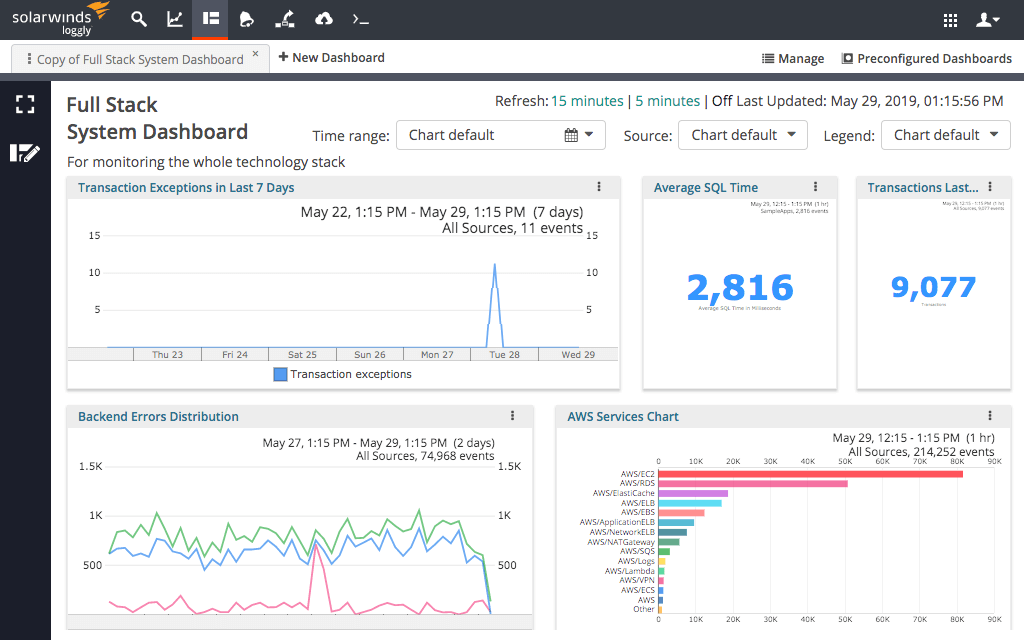
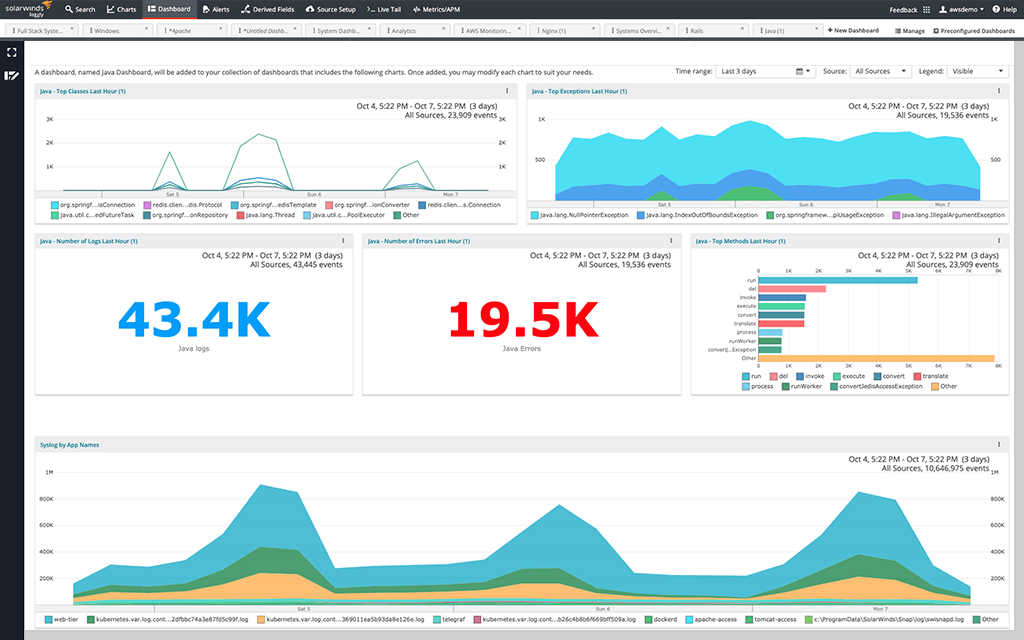
Speed troubleshooting with complete and shared visualization across all logs and data.
Accelerate troubleshooting with dashboards, broad language support, and contextualized searching across all logs and data.
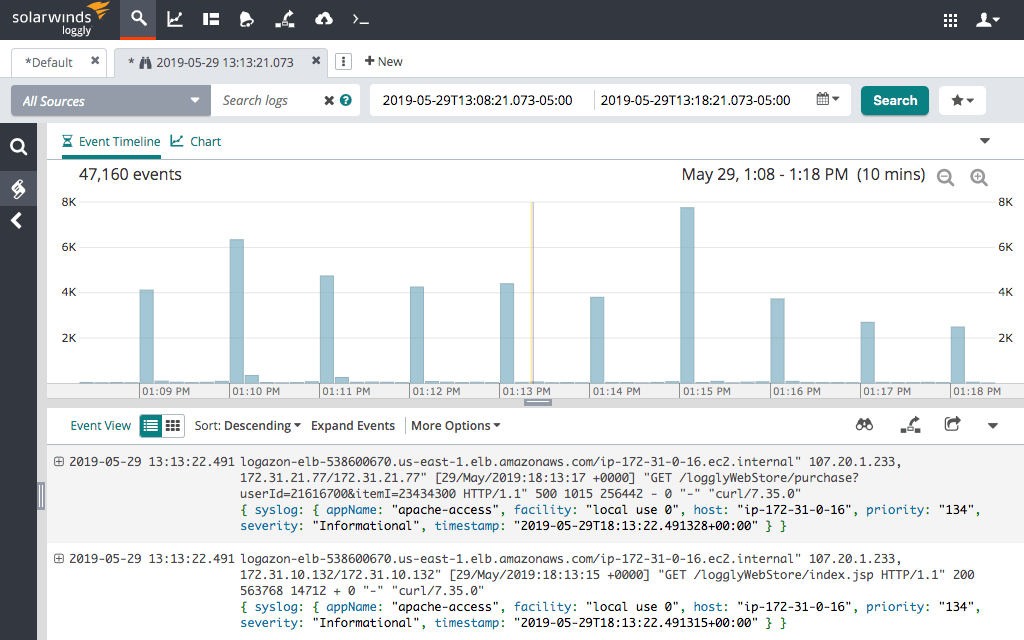
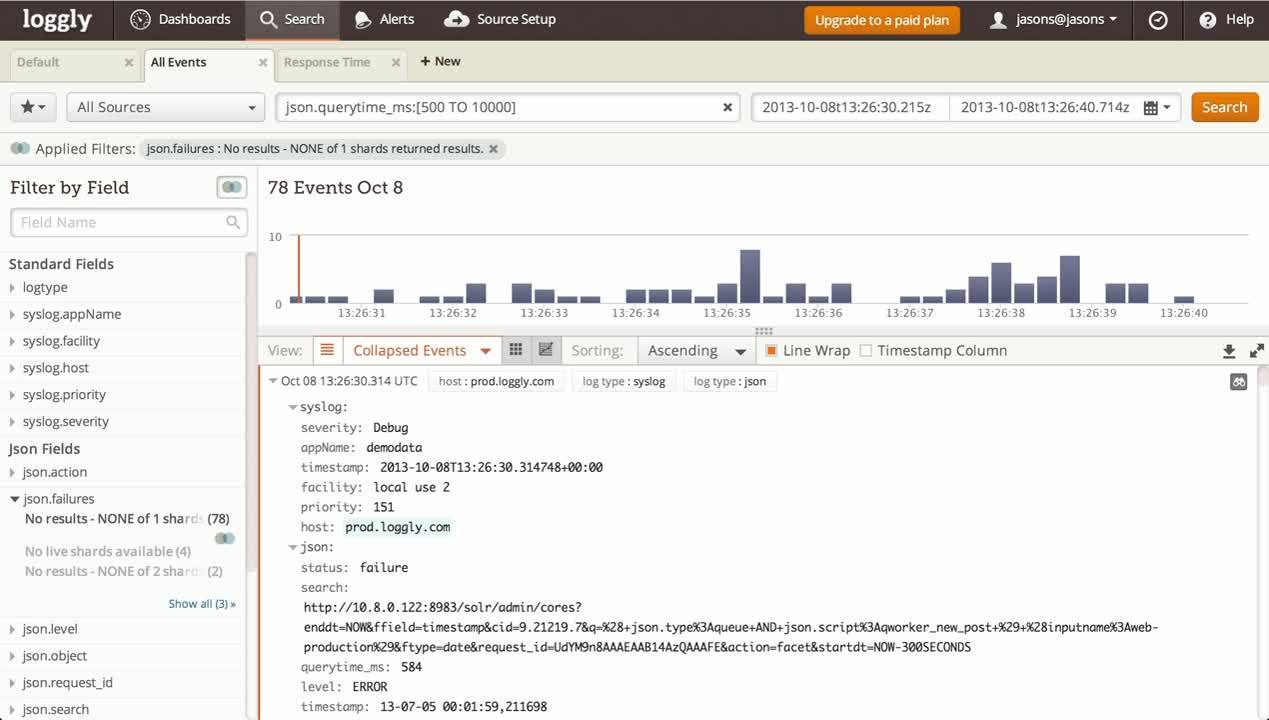
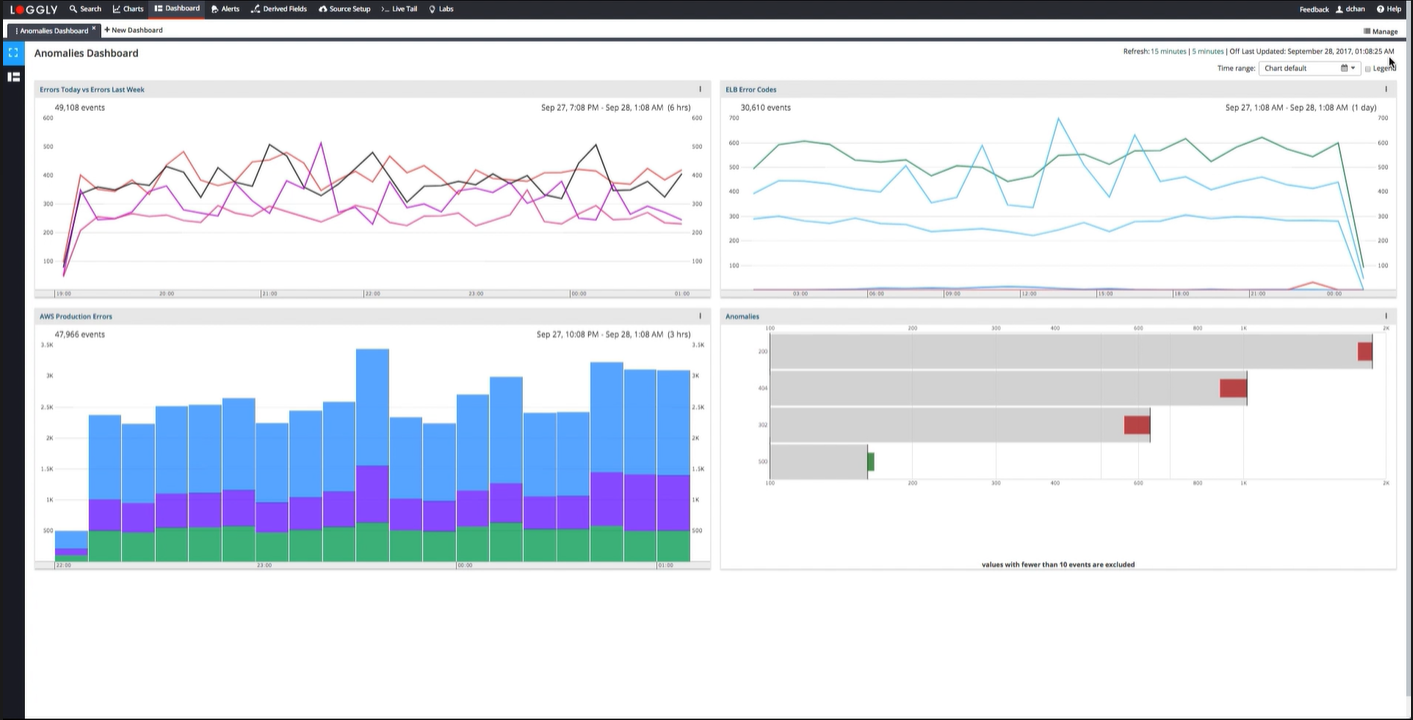
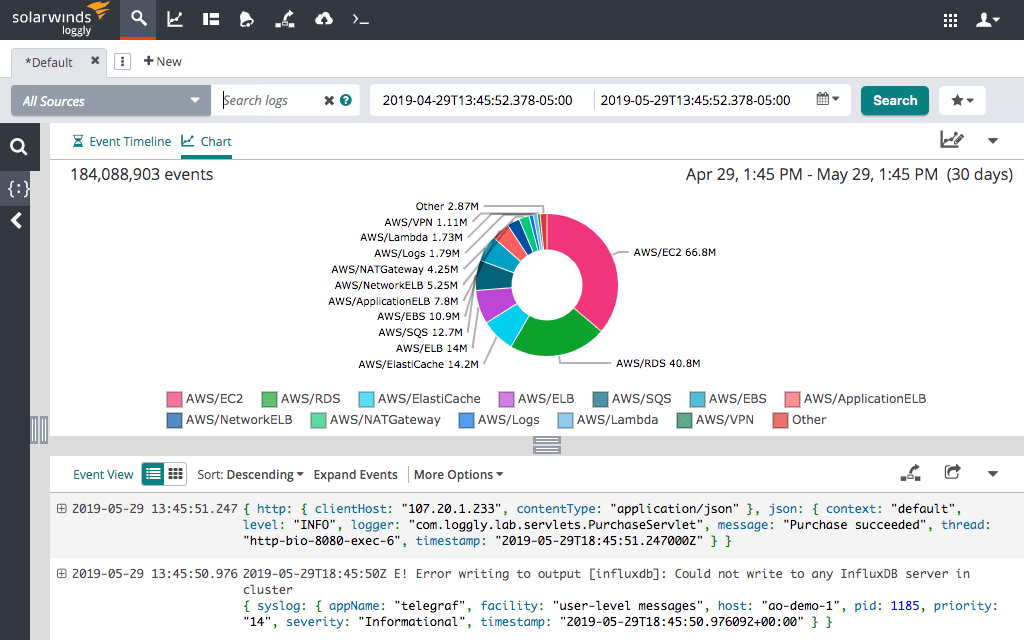
Rapidly identify events in context across all aggregated logs. Diagnose events and issues.
Rapidly pinpoint bottlenecks and failure points using powerful surround search capabilities—seeing events in complete context across all aggregated logs.
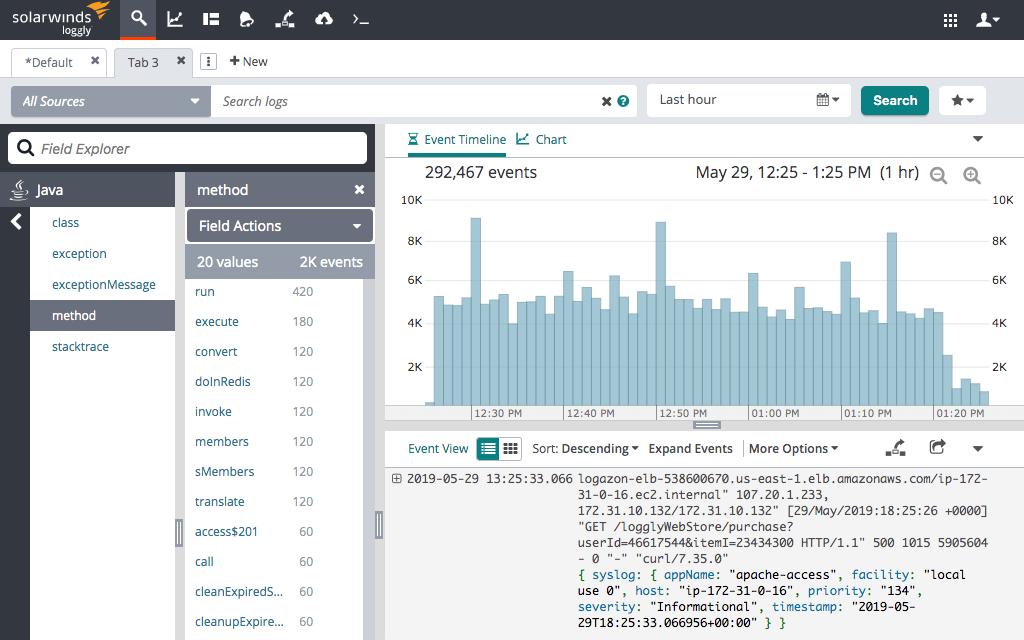
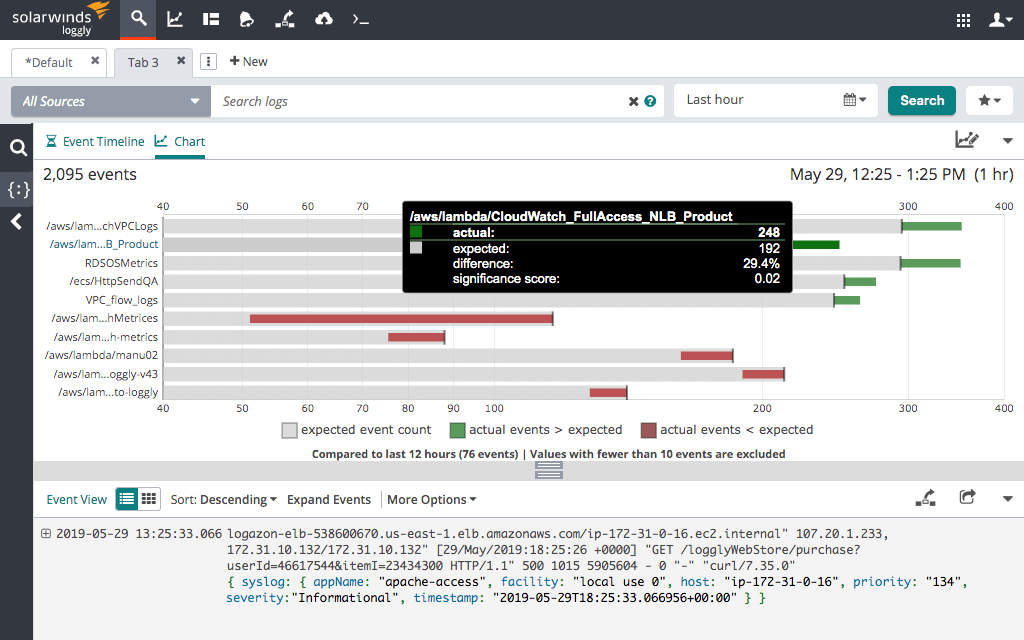
Immediately diagnose events and issues.
Speed triage to immediately diagnose via automated, real-time field exploration to intelligently determine related data.
Fast, powerful searching and alerting over massive volumes of log data.
Resolve Azure application performance issues faster with automatically integrated, end-to-end performance metrics, traces, and logs, spanning Azure IaaS, PaaS, and over 40 out-of-the-box integrations.
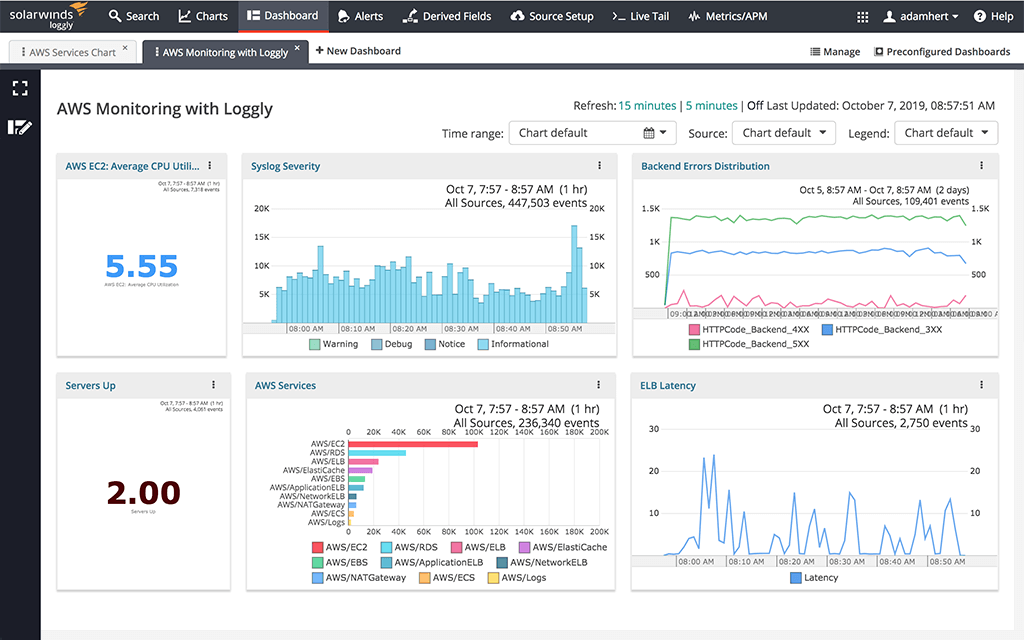
Fast, powerful searching and alerting over massive volumes of log data.
Resolve AWS application performance issues faster with automatically integrated, end-to-end performance metrics, traces, and logs, spanning broad AWS Services and over 60 out-of-the-box integrations.
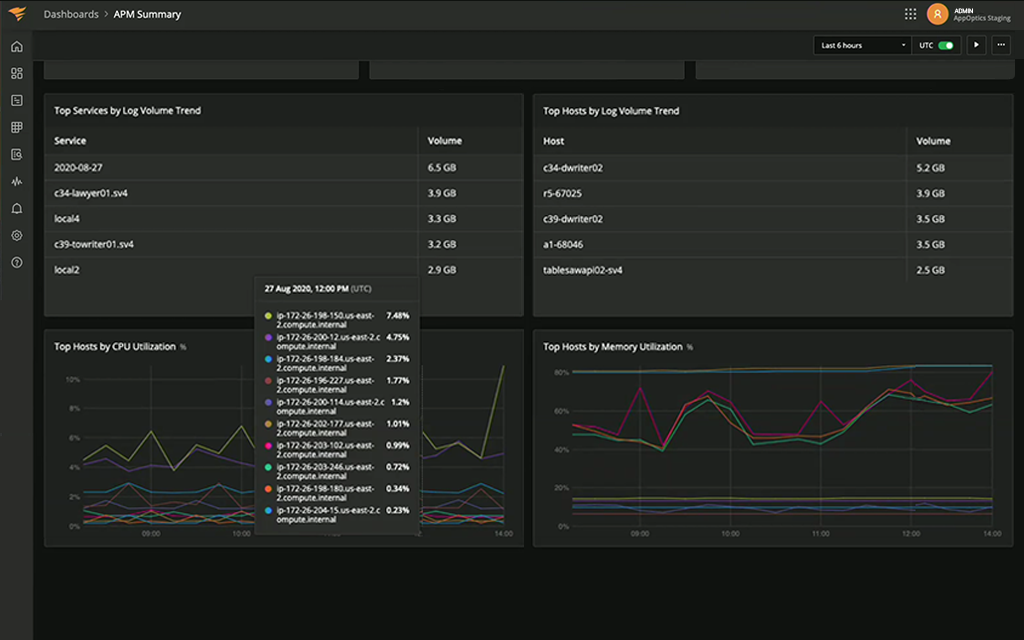
Spot usage patterns across applications, services, and infrastructure.
Spot usage patterns with application, service, and infrastructure-aligned historical analysis of user log AND infrastructure data.
Achieve greater observability with time-series infrastructure and application performance data integrated with your log management.
Understand the implications of suspect log lines (errors, capacity issues, etc.) on application and service performance. Add trace context to your logs to significantly reduce application performance troubleshooting time.
Focus efforts using exception-based analytics.
Manage by exception by identifying variations from normal with powerful log formatting and analytic search capabilities.
See events in context across all related events.
See events in context with automated grouping and linking of related events.
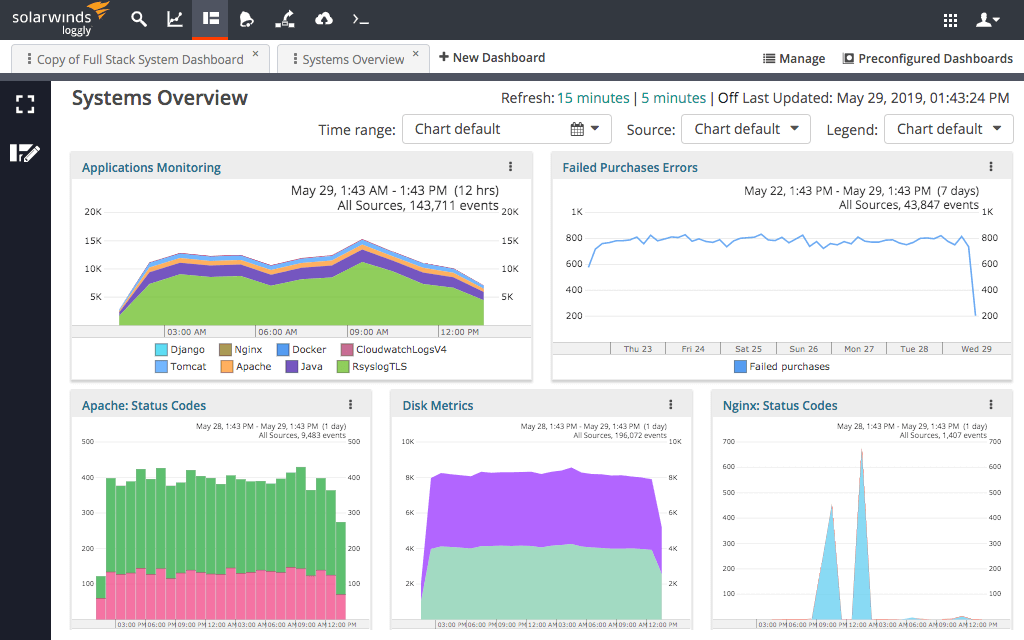
Collaborate across all stakeholders with shared dashboards and visualizations.
Collaborate with all stakeholders via easy-to-use and customized dashboards and visualizations of aggregated data across the stack.
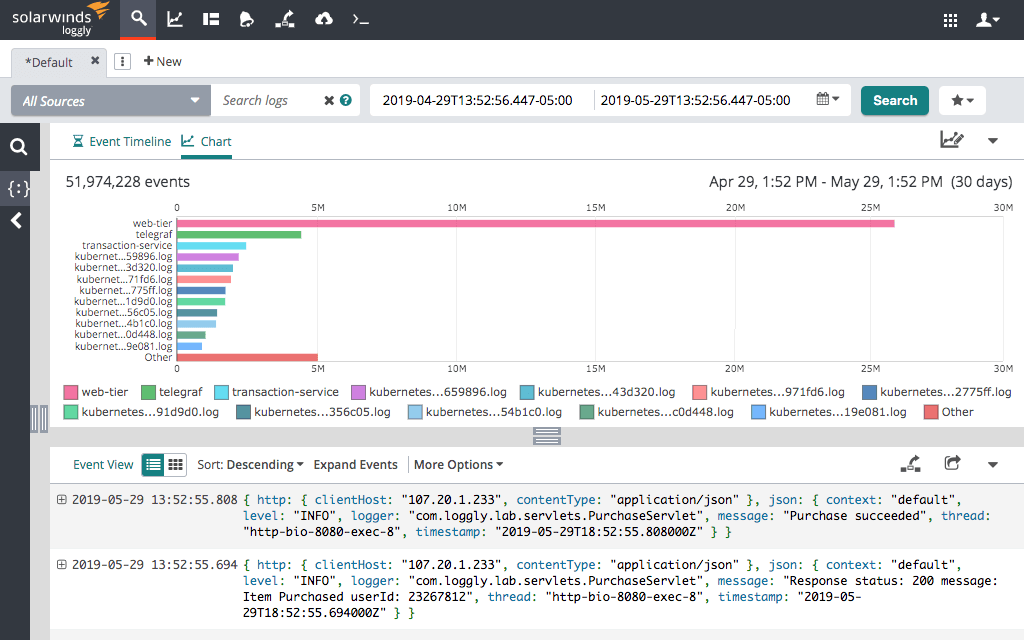
Process large volumes of data while delivering rapid search capability.
Process large volumes of data to quickly search across large and complex environments to see interconnected services, events, and issues.
Cost-effectively scale to massive data ingest volumes.
Scale to massive data ingest volumes with flexible data retention to always have all data needed for proactive analytics.
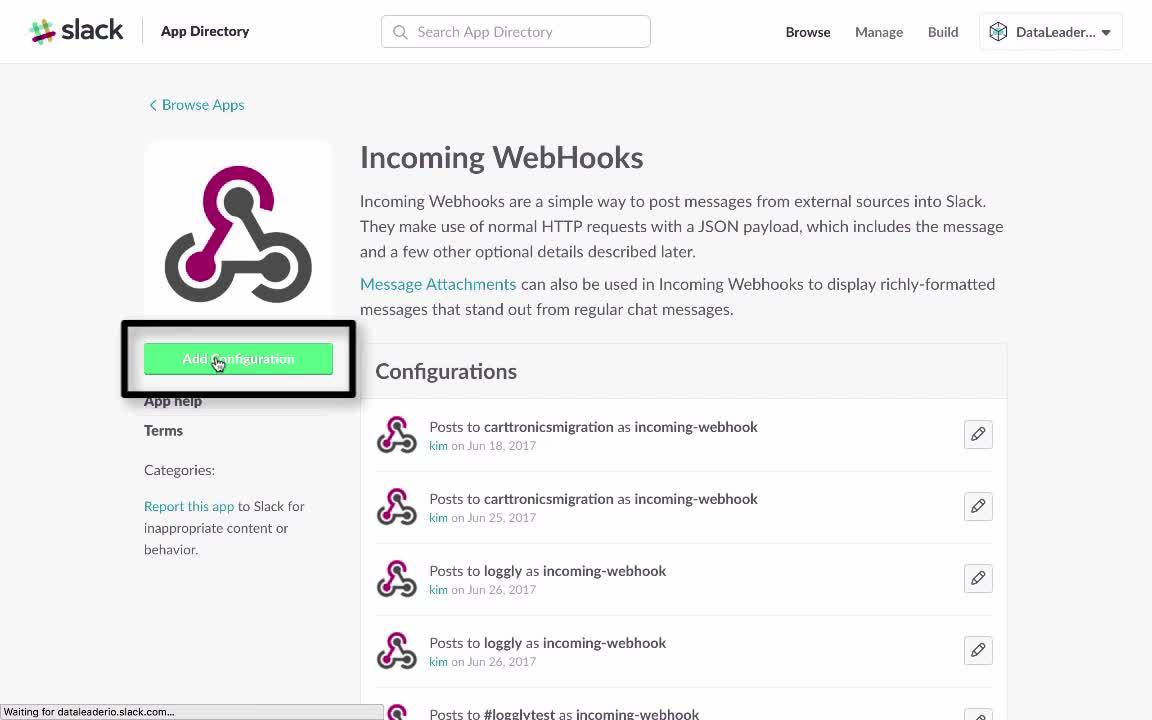
Easy, seamless integration across IT and application team workflow processes.
Process integration across all relevant IT and application teams to avoid downtime with team alerting integrations like Slack, PagerDuty, Teams, custom webhooks, and more.
Loggly Features by Package:
| Standard | Professional | Enterprise | |
|---|---|---|---|
| Centralized log management | |||
| Automated log summaries | |||
| Search and filters | |||
| Single user | Up to 3 users | Up to 5 users | Unlimited users |
| Up to three source groups | Up to 5 source groups | Unlimited source groups | |
| Built-in email alerting | |||
| Fast monitoring with charts and dashboards | |||
| Direct access to support team | |||
| Custom derived field rules | Up to 10 rules | Unlimited | |
| Alerts: Email, webhook, third-party notification systems | |||
| API access | |||
| Archive to Amazon S3 | |||
| Peak overage protection | |||
| Variable custom volume (up to TBs) | |||
| Custom retention periods | |||
| Technical success management | |||
| Loggly live tail | |||
| Integration with GitHub | |||
| Integration with JIRA software | |||
| Anomaly detection | |||
| Federated identity |
Documentation:
Download the Solarwinds Loggly Datasheet (.PDF)
Get in touch with a Solarwinds Solutions Specialist today to Learn More!