
Solarwinds Application Stack Management Bundle
A Complete View of the Application and Its Infrastructure Layers
Click here to jump to more pricing!
Overview:
The Application Stack Management Bundle contains four integrated SolarWinds products: SolarWinds Server & Application Monitor, Virtualization Manager, Storage Resource Monitor, and Web Performance Monitor. Application Stack Enabled Products integrate with each other and have the ability to correlate relationships, resources, and metrics across products and a common dashboard view – the Application Stack Dashboard. Each product in the bundle provides the Application Stack Dashboard, and as additional products are added to a company’s environment, the dashboard is automatically populated with the status and relationship information specific to the added product. For instance, if you have Server & Application Monitor, you’ll be able to see the relationships and status of applications, and server performance. When you add Virtualization Manager, the dashboard will automatically populate to show the relationships between applications, servers, virtual machines and datastores.
With the SolarWinds’ Application Stack Management Bundle, your entire infrastructure team can have end-to-end visibility of their environment and performance. Your team can easily identify trouble areas at a glance using an automatic map showing how these infrastructure layers relate to one another. They can also use this map to perform impact analysis.
Application Stack Management Bundle at a Glance
- End-to-end visibility across various technology silos
- Support for multiple technology vendors
- Pre-built integration, including automated and contextual visibility that extends management across apps, database, server, virtual layer, and storage infrastructures
- Quick and easy setup and customization. Add the dashboard to your NOC view in no time
What Does Application Stack Management Bundle Including?
The Application Stack Dashboard is available with every product in the SolarWinds’ systems management portfolio—Server & Application Monitor, Virtualization Manager, Storage Resource Monitor, and Web Performance Monitor. Each product adds information to the Application Stack dashboard. As you monitor more of your environment, you are able to directly see how infrastructure resources impact application performance.
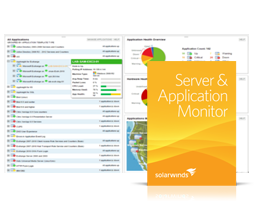
Server & Application Monitor
Expert level application monitoring & troubleshooting with built-in support for 200+ applications
- Provides AppStack visibility to apps, OS, servers & virtualization (basic metrics) layers
- Application management for public cloud and on-premise environments—in a single-pane-of-glass
- Multi-vendor server management, hardware and software asset Inventory, and server remediation
Virtualization Manager
Performance, troubleshooting, capacity, and sprawl management from VM to datastore
- Provides AppStack visibility to VMs, hosts, clusters & datastores/CSVs (comprehensive metrics)
- Deep monitoring to quickly alert and troubleshoot performance, capacity and sprawl issues
- Management actions allow you to remediate issues without leaving the console
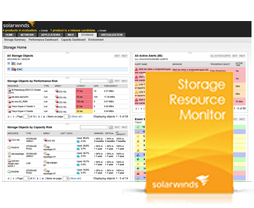
Storage Resource Monitor
Multi-vendor storage performance and capacity management
- Provides AppStack visibility to SAN & NAS array LUNs, Raid groups, volumes, disks & more
- Real-Time storage visibility into multi-vendor NAS & SAN arrays, to include EMC, NetApp, and Dell
- Automated storage capacity planning to identiy hot spots, peak hours, and potential outages
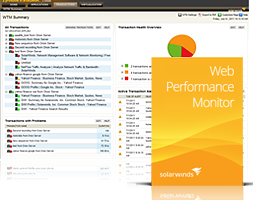
Web Performance Monitor
Measure user experience & troubleshoot application latency issues for internal and customer facing web applications
- Provides AppStack visibility to end user experience for web and SaaS application transactions
- Built-in integration shows dependencies within your infrastructure for your web-based applications
- Agentless & secure API/Web Service/SaaS user experience from multiple locations for optimized app performance
Features:

Automated application to infrastructure relationship mapping
The application stack management dashboard automatically maps relationships between the application and its underlying infrastructure.

Drill into performance details for troubleshooting in one click
With the application stack dashboard, you can identify the root cause at-a-glance, and in a click dive into the performance details.

Solve performance problems right from the Web console
Immediately take action in context—reboot or suspend virtual machines, delete snapshots, kill processes, start websites & services, and more.

Pinpoint virtualization bottlenecks
Automatically detect changing relationships and drill in to troubleshoot resource contention.

Multi-vendor support for applications, servers, hypervisors, and arrays
Visualize performance and relationships for 200+ applications, multiple hardware, storage, and hypervisor vendors.

Quickly customize your view with filter and search capabilities
Filter on severity, business service, application, or any defined property. Easily add this view to your NOC.

Visibility to storage
Trace dynamic relationships from apps, VMs, LUNs, pools, and arrays to find latency & capacity issues.

Monitor end-user experience
Identify slow page load times and troubleshoot whether the problem is due to CSS, images, etc.
System Requirements:
| Hardware | Minimum Requirements |
|---|---|
| CPU | Quad-core processor 3GHz or better |
| Memory | 16-32GB |
| Hard Drive | 2 x 146GB 15k Hard Drives (RAID 1/Mirrored Settings) |
| Software | Minimum Requirements |
| Operating System | Windows Server 2012 or 2008 R2 (64-bit) with IIS installed, running in 32-bit mode. |
| .NET Framework | Versions 3.5 & 4.0 |
| Database | SQL Express comes with the software evaluation. If using a separate SQL Server, we recommend Microsoft SQL Server 2014, 2012, or 2008 R2 Standard Edition. |
| Web Console Browser | Microsoft Internet Explorer version 8 or higher with active scripting, Firefox 13.0 or higher (Toolset Integration is not supported on Firefox), Google Chrome. |
NOTE: The minimum server requirements listed assume default configuration. Significantly increasing the poll rate or statistic collection rate could result in additional load on the server, which may require a larger CPU or additional memory.
Screenshots:
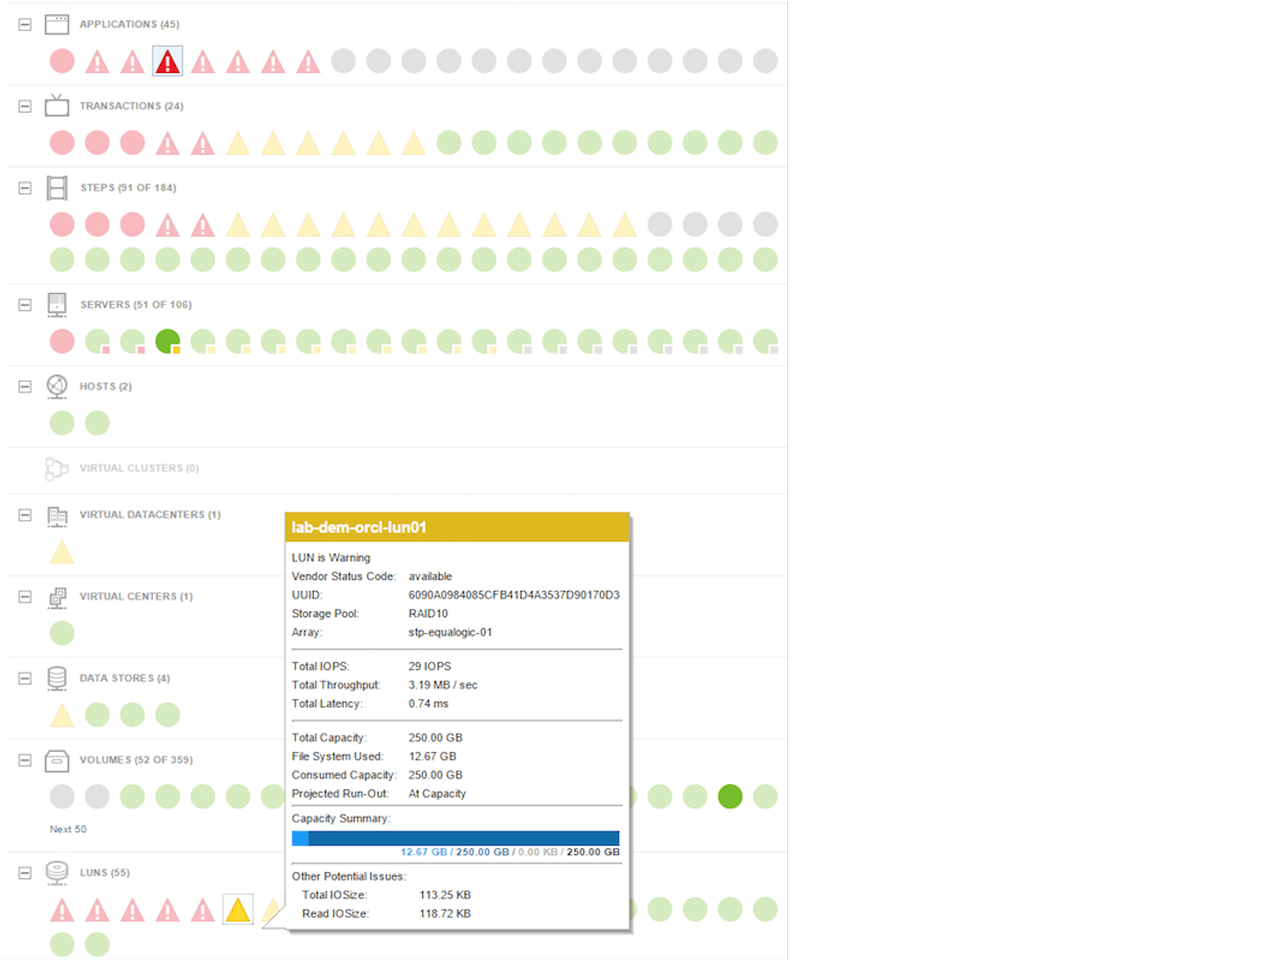
Identify the infrastructure impacting the app
Quickly identify the root cause of application issues—app to LUN and everything in between.
Correlate resource trends with app performance
200+ packaged apps, plus custom apps linked to their specific infrastructure for end-to-end visibility
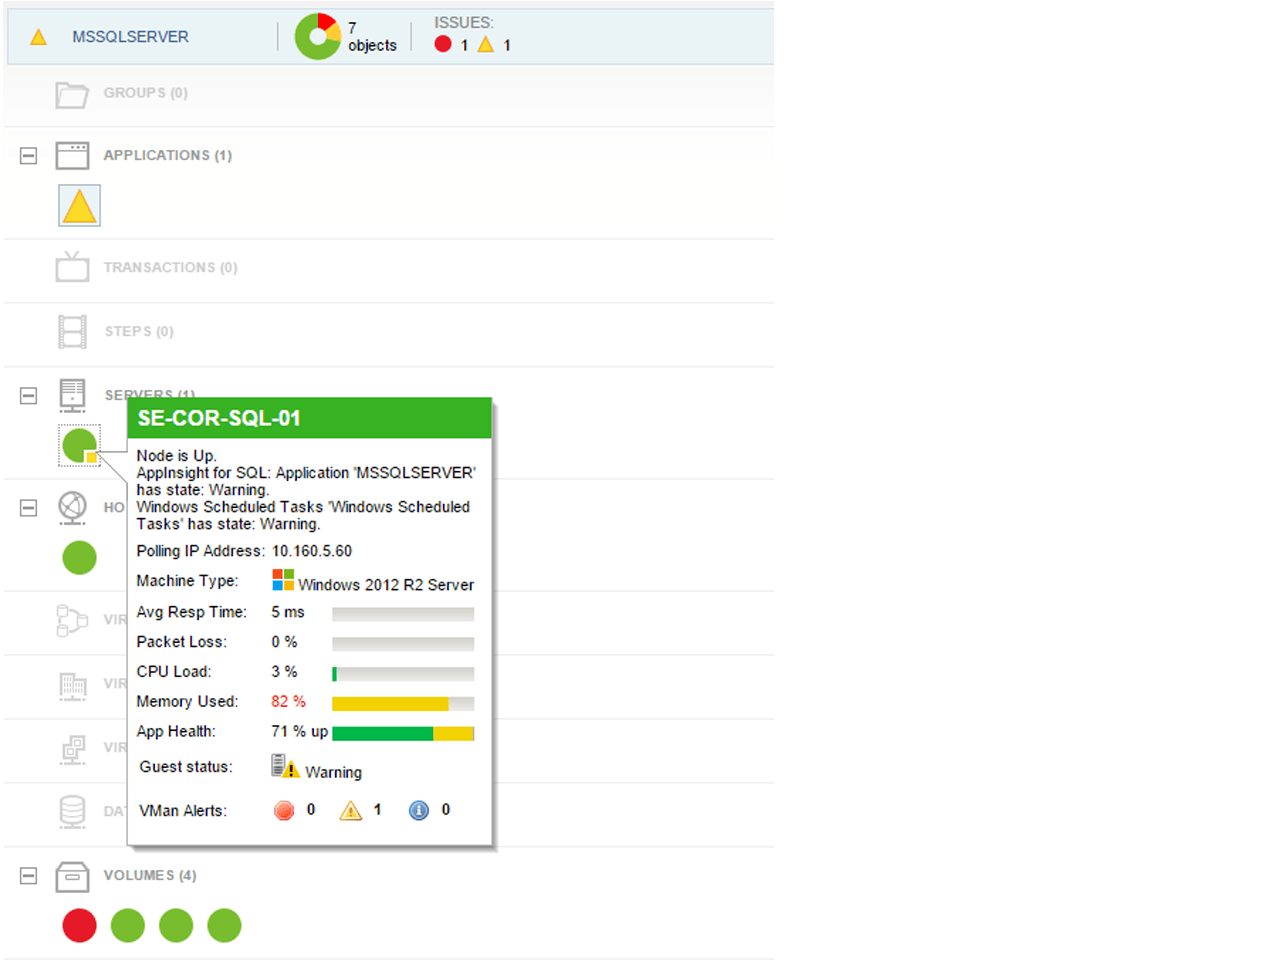
Prioritize problem resolution
Prioritize critical issues to identify infrastructure problems impacting user experience and key apps
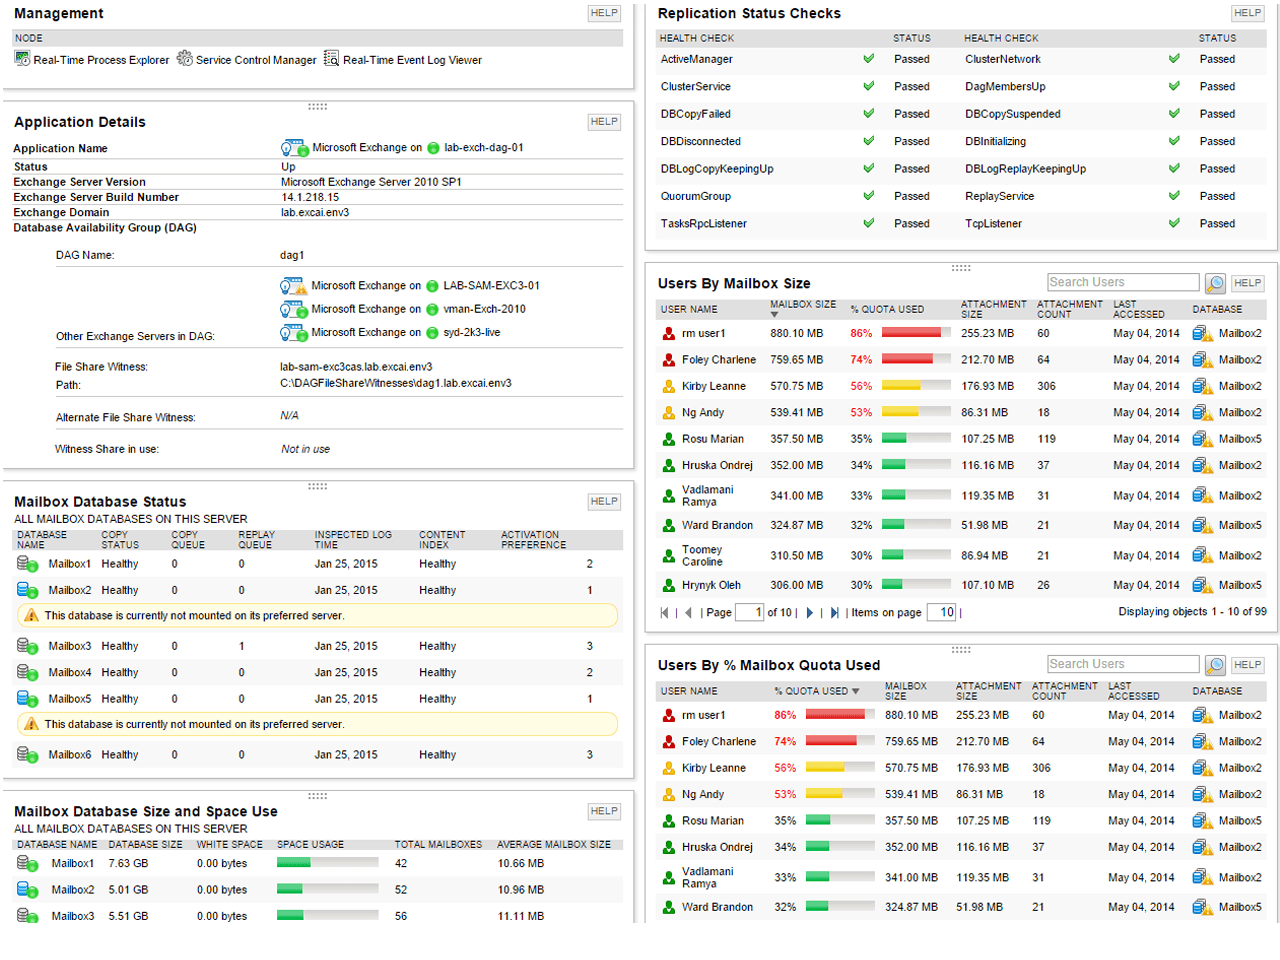
Exchange server management dashboard
100+ Exchange metrics in one dashboard—DB size & use, I/O, and more without writing Powershell or WMI

Customize your view
Customize your AppStack dashboard specific to your application, infrastructure, or business unit
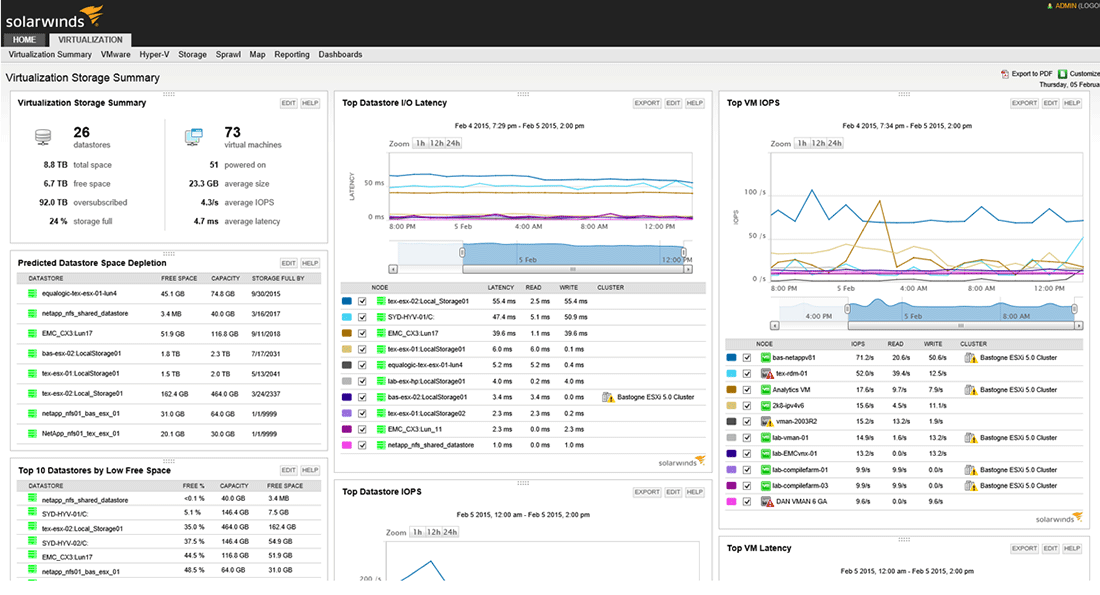
Pinpoint virtualization bottlenecks
Automatically detect changing relationships and drill in to troubleshoot resource contention
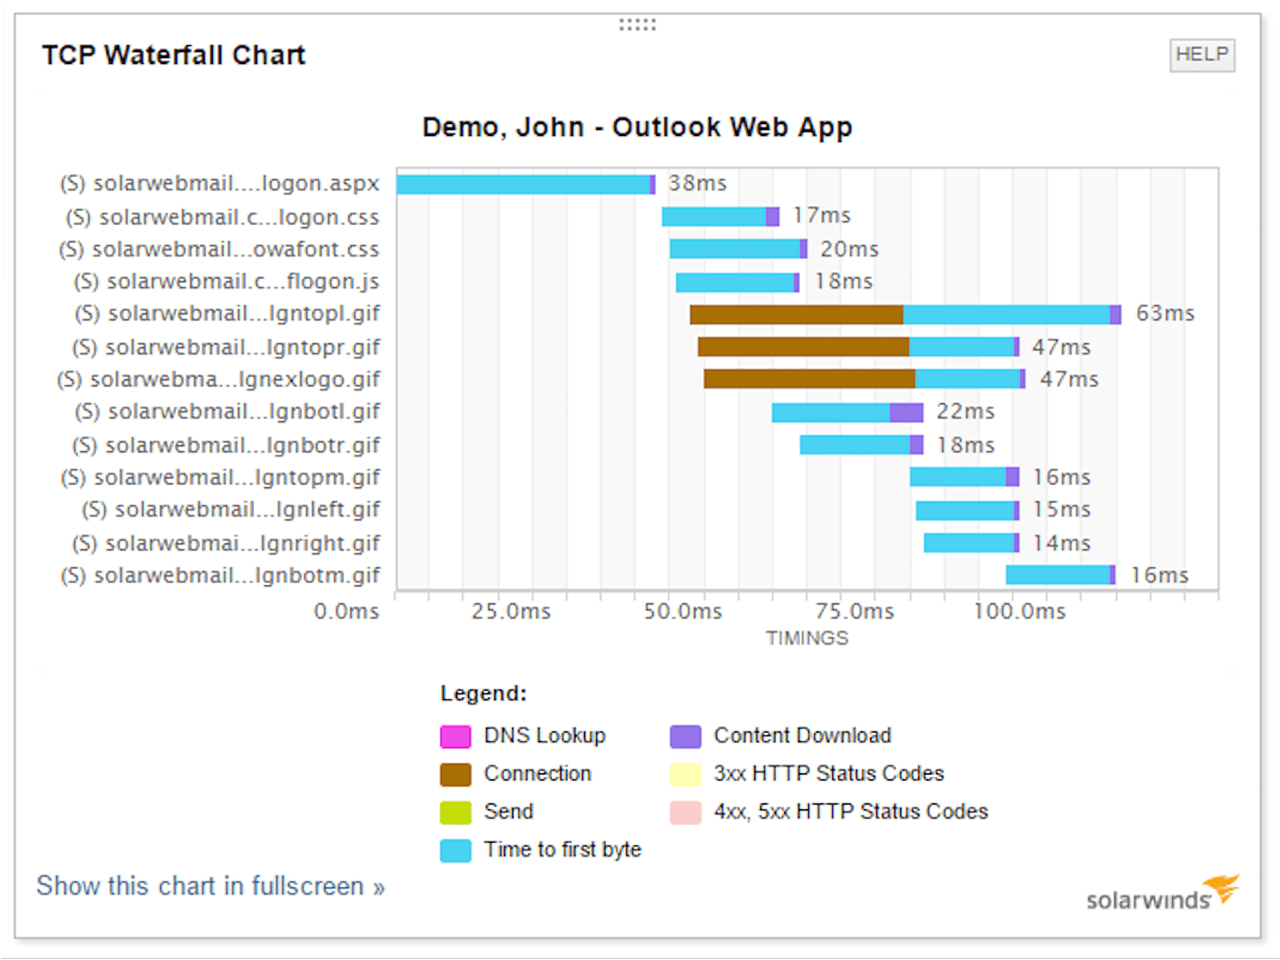
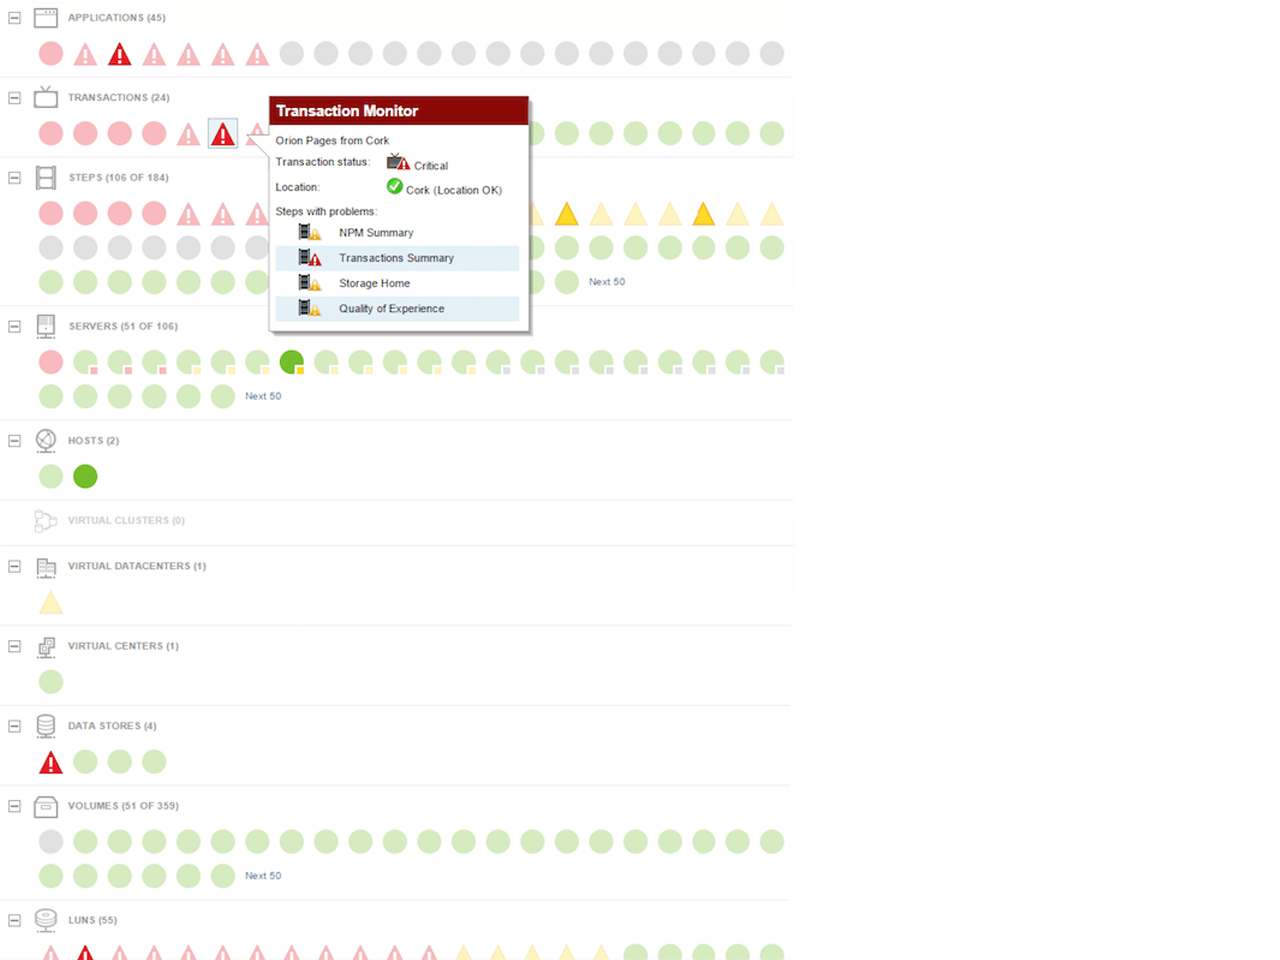
Troubleshoot slow user experience
Identify slow page load times and troubleshoot to determine if the problem is due to CSS, images, etc.
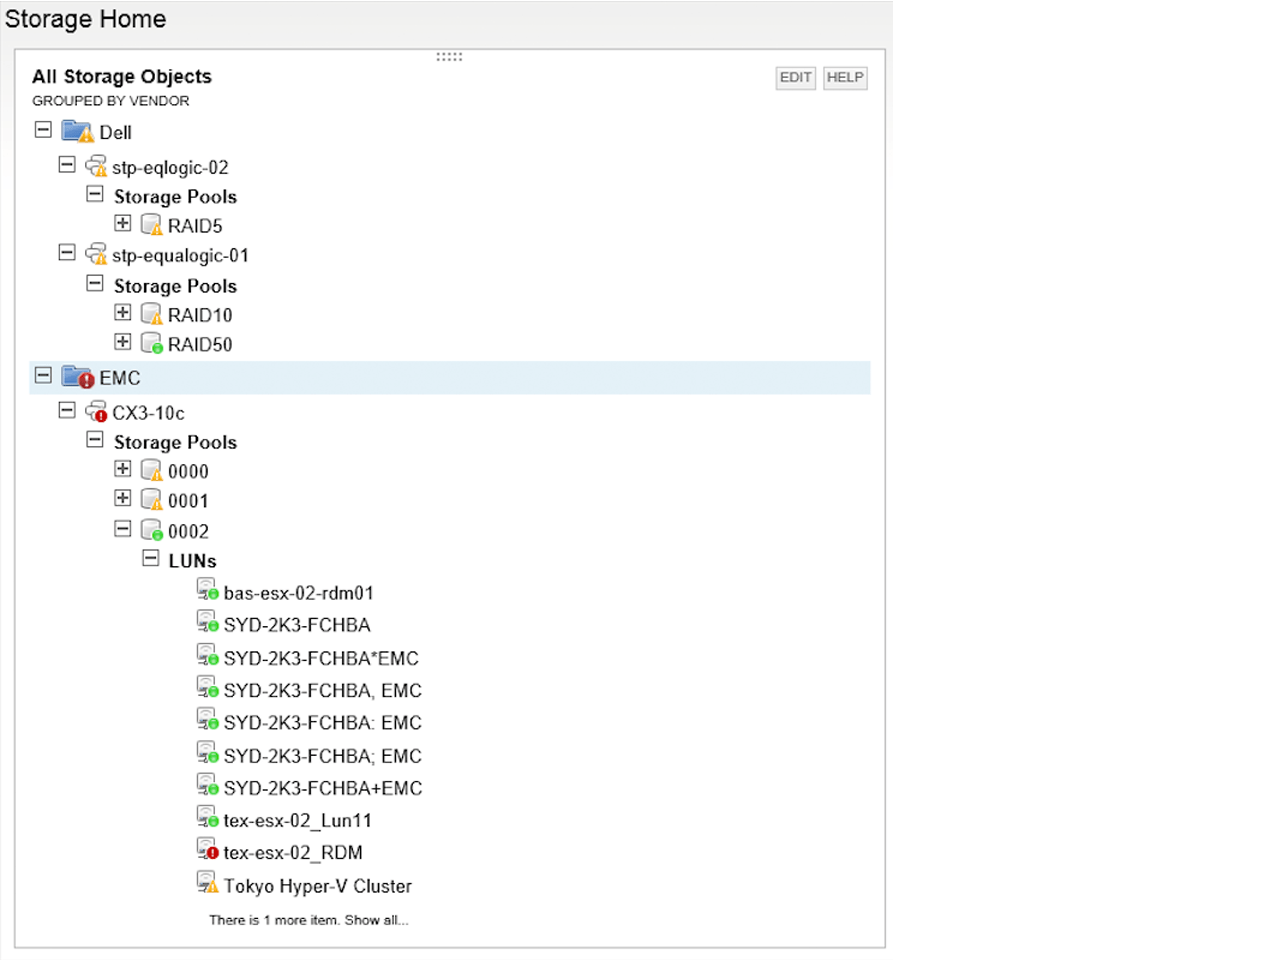
Heterogeneous storage monitoring
Single-pane-of-glass monitoring for multi-vendor storage arrays from EMC, NetApp, and Dell to name a few
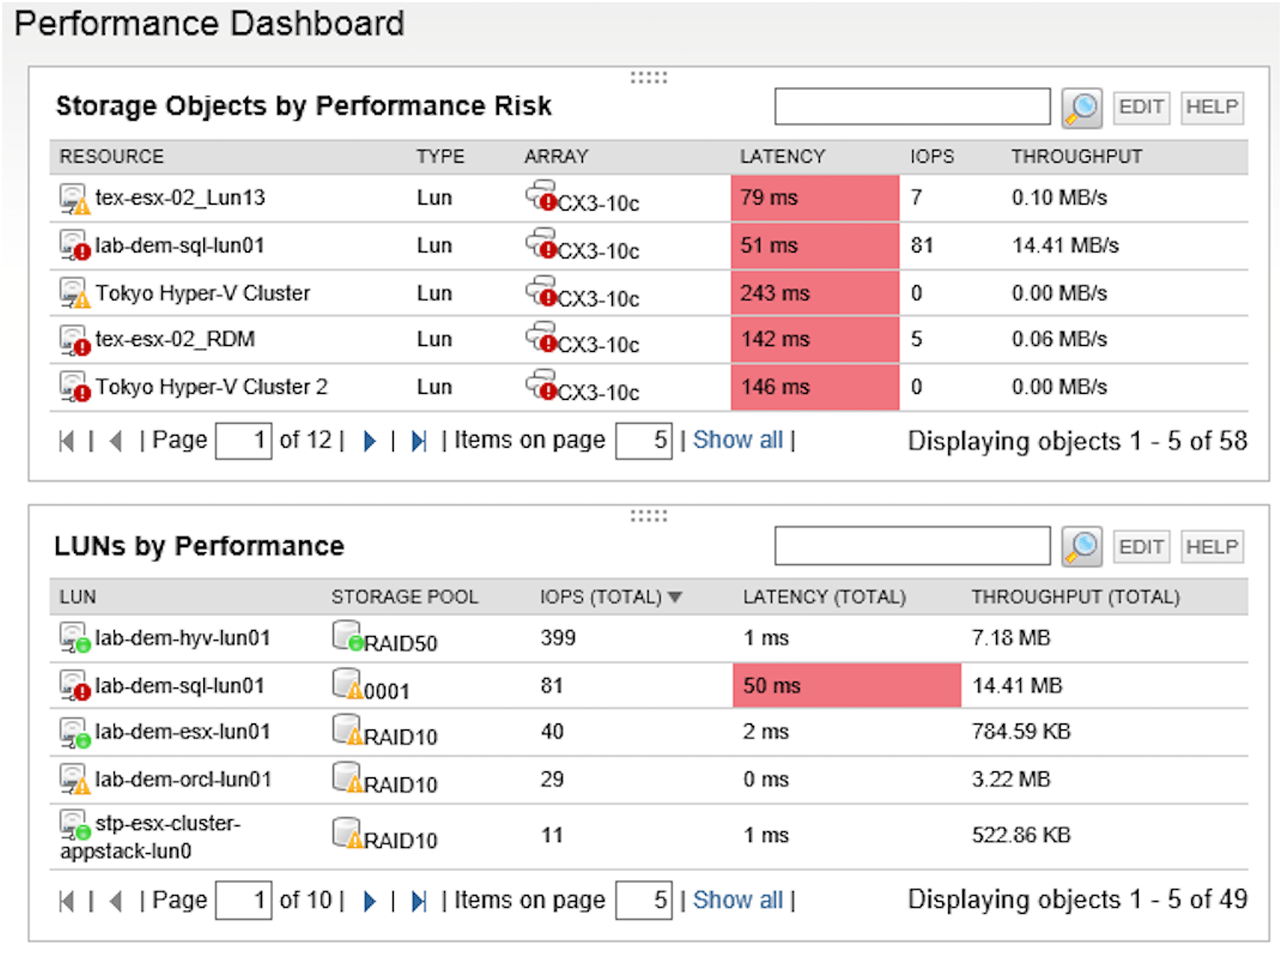
Real-Time storage performance monitoring
Unified NAS & SAN performance monitoring with alerting on status and usage thresholds
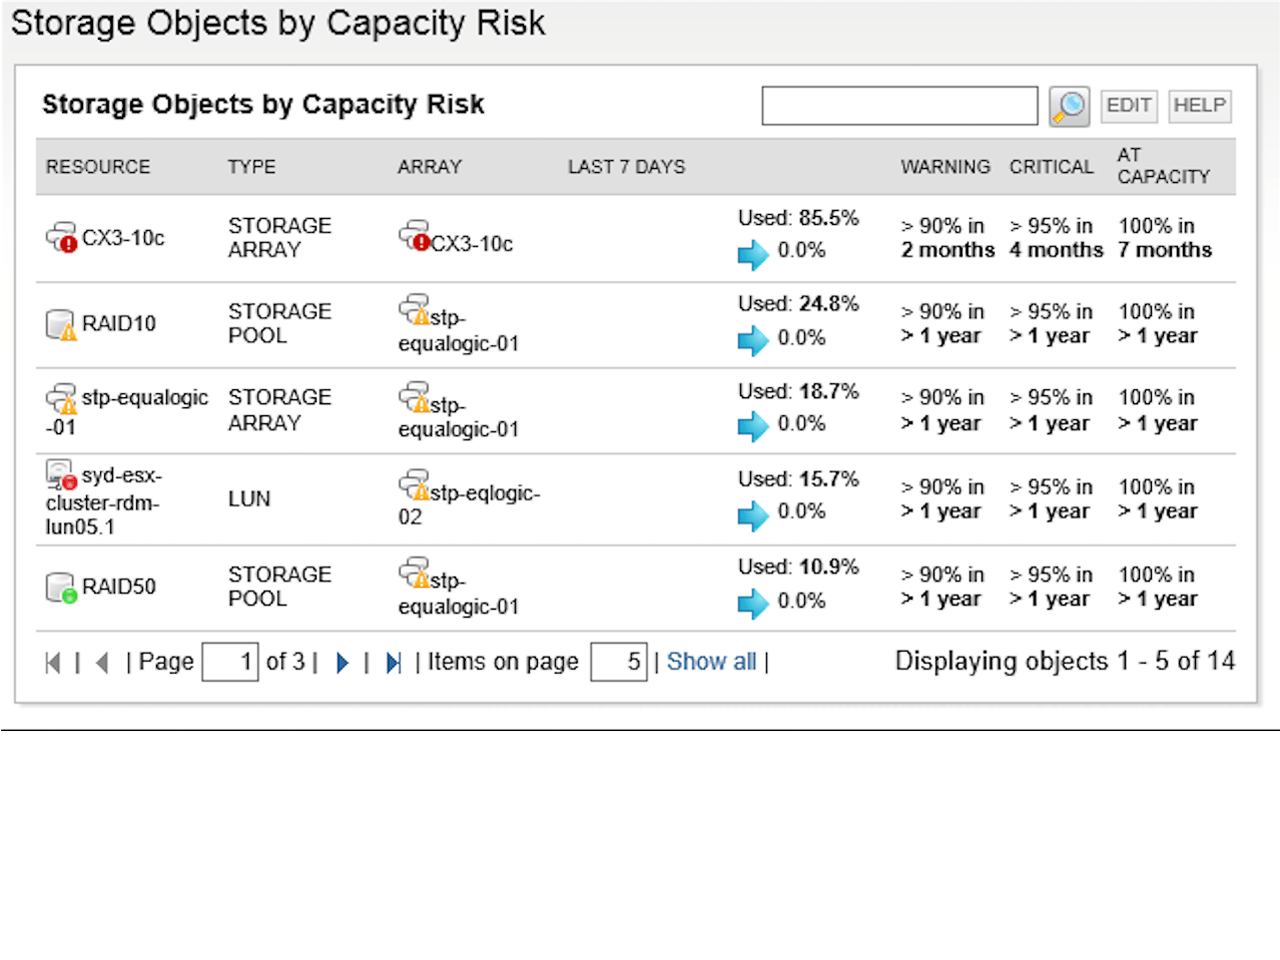
Automated storage capacity planning
Monitor storage capacity with easy to view forecasted growth rates—project when capacity will be reached
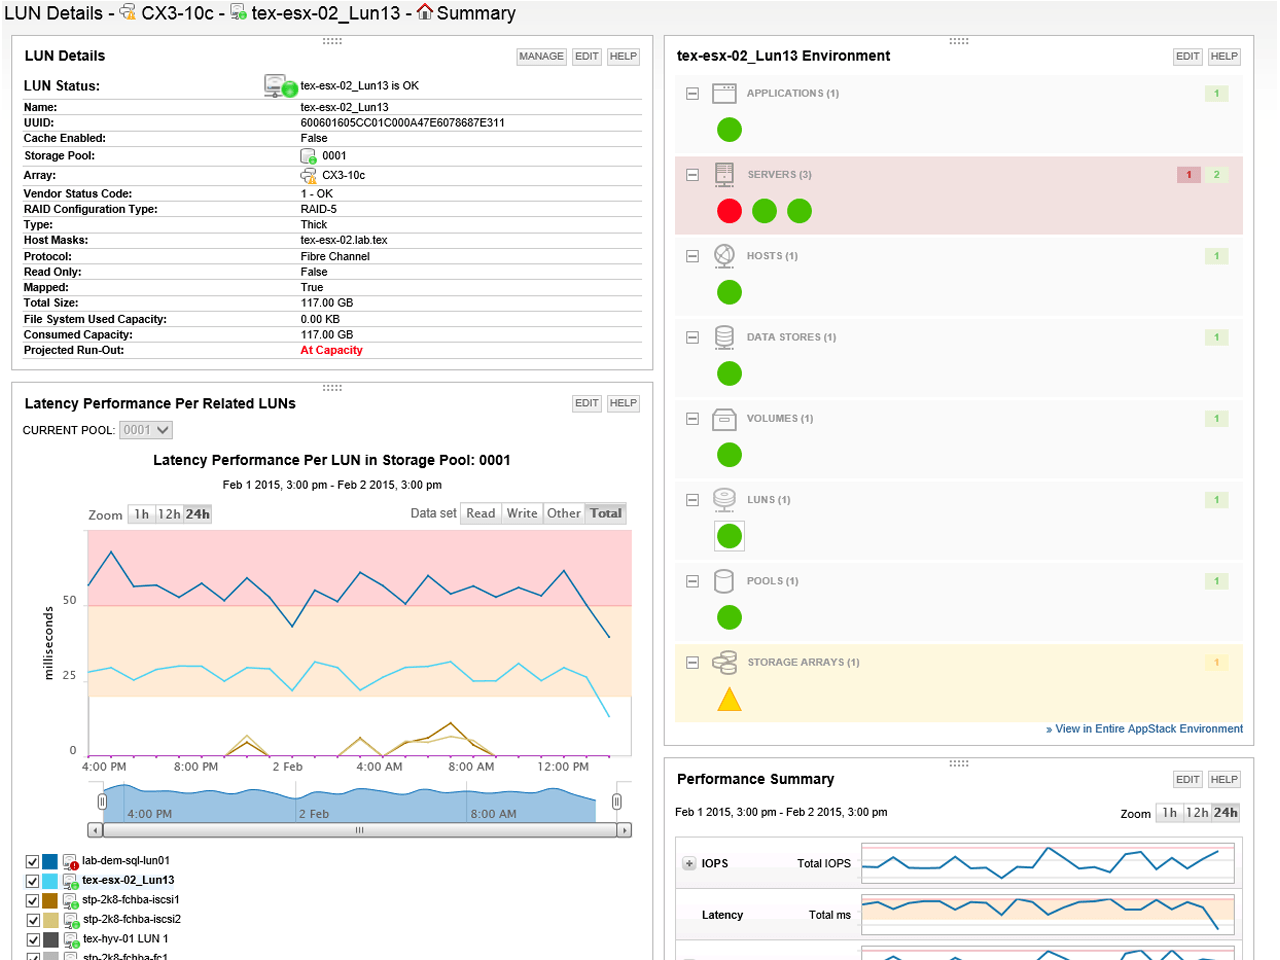
Visbility to storage
Trace dynamic relationships from apps, VMs, LUNs, and pools & arrays to find latency & capacity issues
Documentation:
Download the Solarwinds Application Stack Management Bundle Datasheet (.PDF)